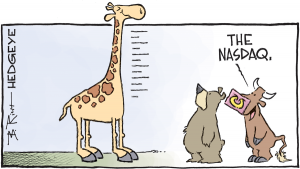
Four Facts You Need To Know About Bear Markets
Posted onGold prices surged for the second week in a row last week, continuing the strong rally phase that has been in place since late December.
The gold and silver markets are on fire since the start of 2017, as investors pour money into the metals arena. Concerns over rising inflation, uncertainty over the impact of certain Trump administration economic including potential protectionist moves, and by political divisiveness in Europe as rising populist movements gain steam especially in France, are driving metals prices higher.
The Stock-Gold Connection
What is interesting for investors right now is that precious metals are rising at the same time that stocks are hitting new all-time highs.
Can this last? History says no.

Fact One: The current rising cycle in U.S. stocks is set to hit its eighth birthday in March, that will make it the second longest running bull market in history since World War II. A bear market is defined as a sell-off of 20% or more.
Fact Two: The average bear market in U.S. stocks (measured by the S&P 500) lasts about 272 days, with declines of about 28 percent, according to a JP Morgan study. More recent bear markets have been more severe.
Fact Three: The Bear Market that began in March 2000 saw a -40% decline.
Fact Four: The Bear Market that began in October 2007 saw a -57% decline.
What This Means for Your Portfolio
Professional money managers and family offices have been gravitating toward gold as a hedge. Historically, gold tends to rise – often significantly – when equity markets are falling. Gold also acts as a hedge against inflation. The price of gold also increases during inflationary period, which many economists believe we are entering into now.
During the double-digit hyperinflation that emerged here in the U.S. in the 1970s, gold appreciated significantly and far outpaced the rate of inflation. That preserves wealth and purchasing power for those who own gold in their portfolio.
What to Watch This Week
Gold traders will be monitoring political developments in the Trump administration, a Congressional appearance by Federal Reserve Chair Janet Yellen and a number of key economic reports this week.
Tuesday
- January producer price index is scheduled for release (inflation gauge and the producer level)
- Fed Chair Janet Yellen will testify on the state of the U.S. economy before the Senate Banking Committee House.
Wednesday
- Fed Chair Janet Yellen will testify on the U.S. economy before the House Financial Services Committee.
- January Consumer Price Index data is scheduled for release.
- January Retail Sales report is slated for release and will offer clues on the health of consumer spending at the start of the year.
Gold and Silver – Best Buying Levels Of the Year Could Be Now
Gold and silver prices have surged since the beginning of 2017, and are already outpacing the gains in the stock market. Silver is up over 11% since the start of the year, Gold is up 6.50%, while the S&P 500 is up 3.33%.
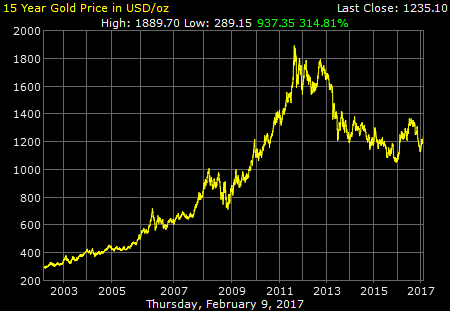
Here is a chart that shows the price of spot gold over the last 15 years.

Signs of higher inflation and faster consumer activity will support the current uptrend in the gold and silver market. Higher prices are forecast for the metals markets throughout 2017 and current levels may offer the best buying opportunities of the year.
Current price: Spot gold is trading around $1,220 an ounce, while silver is trading at $17.80 an ounce.
Gold is approaching a key psychological resistance zone at the $1,250 level. This still remains well below the $1,340 an ounce level that gold traded in the wake of the U.S. presidential election on November 9.
Rare Coins Appreciate Faster Than Gold
The latest Knight Frank Wealth Report for 2016 confirms that ultra-high-net worth individuals prefer collectibles to bullion and for good reason. The price of gold and rare coins does not always move in lockstep. Studies have shown that rare coins typically rising during inflationary periods and outpace the gains seen in the price of spot gold.


