The First Early Gold Coin to Feature a Native American
Posted onA new Quarter Eagle gold coin, worth $2.50 in face value was issued in 1908 – known as the Indian Head. This is the first coin to feature a real Native American. Earlier coins that featured Native Americans were stylized portraits and did not represent real people. Also notable to collectors, the Indian Head gold pieces that survive today remain the only U.S. circulating gold coins with a recessed design – or one that is in sunken relief below the surface of the coin.
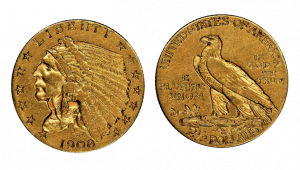
Boston sculptor Bela Lyon Pratt, a student of Augustus Saint-Gaudens, designed this arresting coin. The obverse reveals a dramatic head of a Native American man, wearing a headdress and facing left. The designer’s initials, BLP, are etched just above the date.
Pratt based the design on the reverse of the 1907 $10 gold coin: The reverse features a standing eagle on a smattering of arrows, with its left talon showcasing an olive branch in place. The mint mark is revealed on the left side of the arrowheads.
The U.S. Mint produced Indian quarter eagles intermittently from 1908 until 1929. Within that series, there are 15 different varieties – with the rarest being the 1911-D. Only 55,680 in 1911 at the Denver mint were produced – and that is considered to be a key date for this coin. Key date coins are those with a low mintage or with mintages with few survivors and they are prized in the world of numismatics.
During this time period, the public harbored an unfounded concern that the recessed design of the Gold Quarter Eagle would collect germs. In fact, well-known Philadelphia numismatic Samuel Chapman wrote to President Theodore Roosevelt in 1908 after the first issuance to level a critique of the new design. The indentations in the new Indian Head Quarter Eagles would collect dirt and germs, Chapman claimed.
Due to these fears, few people were interested in saving these coins for their coin collections. Today, only a few circulated pieces are known to survive, perhaps from prescient collectors who ignored the public hysteria, but ultimately had to sell their coins in favor of food for family members during the Great Depression.
Many survivors today boast a striking bronze-gold color. Imagine the stories these coins could tell of this era just before the Great Depression. See our collection of Indian Head Quarter Eagles that we have on offering now.
Want to read more? Subscribe to the Blanchard Newsletter and get our tales from the vault, our favorite stories from around the world, and the latest tangible assets news delivered to your inbox weekly.
Four Reasons Why Gold Has a Place in Your 2023 Portfolio
Posted onGold Offers Diversification that is Disappearing

Diversification is what prevents catastrophic loss. The problem is that many investors are not as diversified as they think they are. In recent decades, assets have begun to exhibit similar movements which means that one of the most important strategies an investor has is beginning to falter. In fact, between the periods of 1990 to 2000 and 2006 to 2016 cross-asset correlation increased by 33%. This trend puts investors in a difficult position because the market today offers fewer opportunities to diversify investment. Fortunately, gold gives investors a chance to renew their diversification because it is an asset that has had a low or negative correlation with equity indices for almost twenty years.
Gold Offers Improved Liquidity
While US citizens often choose to hold gold as an investment, many individuals in other countries use gold as a way to boost liquidity. For example, it is common for gold owners in India to rely on gold as a source of collateral when seeking a loan. This means that gold owners can often obtain capital faster when they pledge gold which is universally acknowledged as a global currency. For this reason, just over half of investors in India own some form of gold. Moreover, the average Indian household stores 11% of its wealth in gold. Loan issuers can process transactions faster when they have the kind of assurance that comes from gold. The relationship between gold and liquidity has grown since the onset of the pandemic which has left many people seeking access to capital.
Gold Helps Protect Against Tail Risk
Tail risk represents the fact that remote events happen less frequently, but when they do occur they generate an enormous effect on outcomes. The word “tail” is used because it refers to the left and right sides of a normal distribution curve – a bell curve – which resembles tails. This concept is relevant to those investing in precious metals because the COVID pandemic was an upheaval that had a massive impact on all aspects of life, especially finances. It is no surprise that silver and gold delivered returns of 47% and 24% respectively in 2020 when the pandemic began to impact everyday life. These events serve as a reminder to investors that the unthinkable can in fact happen and when it does it is best to be prepared with an asset class that will outperform when tail events occur.
Gold Can Create Stability When the Yield Curve Inverts
An inverted yield curve has preceded the last seven recessions. The current yield curve is inverted which has prompted many investors to reconsider their strategy. The yield curve inverts when investors become pessimistic about the economic setting of the near term. As a result, investors demand a greater return on short-term investments which are seen as riskier. Equity and bond investors are taking the most recent inversion as a warning that they need to broaden the range of assets held in their portfolios. Many of these same investors remember that the value of gold increased dramatically after the global financial crisis that started in 2008 when the Producer Price Index for gold rose 101%. Forward-thinking investors are applying lessons from the past to protect their future.
Want to read more? Subscribe to the Blanchard Newsletter and get our tales from the vault, our favorite stories from around the world and the latest tangible assets news delivered to your inbox weekly.
Why The Next 20 Years Won’t Look Like The Last 40
Posted onWhen a man like Russell Napier speaks, people listen.

And they should. In the summer of 2020, he forecast the inflation of today long before anyone saw it. There were many who didn’t agree with his assessment. After all, we had not seen any meaningful inflation in about 40 years.
For nearly 30 years Professor Russell Napier has advised global institutional investors on their asset allocation strategies. He is also the author of Anatomy of The Bear: Lessons From Wall Street’s Four Great Bottoms, which examines how bear markets form and how they end. He is the founder and course director of The Practical History of Financial Markets course that is part of the Edinburgh Business School MBA.
In recent months Napier has made some of the boldest forecasts of his career. When asked what he sees ahead for the US economy he has two words: financial repression.
The term financial repression describes a setting in which the government allows the rate of inflation to exceed nominal interest rates. Why do this? Because doing so enables the government to diminish debt via inflation. As Napier explains, “engineering a higher nominal GDP growth through a higher structural level of inflation is a proven way to get rid of high levels of debt.”
Napier sees this as an imperative because the current total private sector and public sector debt in the US is at 290% of GDP. At this level, it will not be long before the government is forced to engineer financial repression to avoid disaster.
He expects consumer price inflation to settle into a range between 4% and 6%. Napier explains that this is the likeliest range because it is what the government can get away with because financial repression, by design, steals from savers and old people. Therefore, it must be done slowly to avoid the pain that is too intense.
What does this mean for investors?
Napier has thoughts.
He explains that “gold will do well once people realize that inflation won’t come down to pre-2020 levels but will settle between 4% and 6%.” This makes sense because it is what we have seen before.
Financial repression was used in the US between the period of approximately 1945 and 1975. During this same period, gold increased by approximately 72%.
Government bonds will likely be a bad place to be invested because the rise in the cost of goods will exceed the interest rate earned on those investments.
Even equities will present problems because so many investors have committed their savings to index funds largely composed of companies that fared well in the previous decades which were fundamentally different from what Napier believes is ahead of us.
The problem for most investors is that financial repression is a foreign concept because we have not seen it for 40 years. “Many investors today still pretend that we’re in the system that we had from 1980 to 2020. We’re not. We’re going through fundamental, lasting changes on many levels,” he remarks.
Forward-thinking investors who heed Napier’s words will be well positioned to not only weather the coming climate but to flourish in it.
Want to read more? Subscribe to the Blanchard Newsletter and get our tales from the vault, our favorite stories from around the world and the latest tangible assets news delivered to your inbox weekly.
The State of the Economy and Gold: Tipping Toward Recession
Posted onYou may not have noticed, but gold has been up 10% since early November. Indeed, gold jumped again this week scaling the $1,800 mark to hit a new three-and-a-half-month high. Comments from Federal Reserve Chairman Jerome Powell suggesting the central bank will pull back the pace of its interest rate hikes boosted gold and depressed the dollar.

Let’s take a look at the state of the U.S. economy and what it means for gold.
Recession Looming. As rising interest rates impact the economy and higher prices derail consumer spending, a recession is a forecast for early 2023. Here’s what Beth Ann Bovino, Chief Economist, U.S. & Canada S&P Global Ratings, says: “Economic momentum has slowed with a recession next year increasingly likely. As extremely high prices damage purchasing power and aggressive Federal Reserve policy increase borrowing costs, we continue to expect a shallow recession for the U.S. economy in the first half of 2023. Our U.S. GDP growth forecast is 1.8% for 2022 and -0.1% for 2023.”
What this means for gold: The Fed could ease monetary policy in 2023 to support an economy in recession, which will further weaken the U.S. dollar and in turn boost gold. Inflation has eased slightly, but still remains high opening the door to stagflation (low or no economic growth and high inflation) and that is positive for gold. In fact, gold is the best stagflation performer since 1973 with a 12.8% annualized return, according to a Gold Hub.
Midterm election: Americans now face a divided government, which is expected to lead to a gridlocked Congress for the next two years. The Republicans control and House of Representatives and the Democrats control the Senate, both with slim majorities. Don’t expect any significant changes in economic policies. Split government rule increases the risk of a government shutdown and a bruising fight over the debt ceiling in 2023.
What it means for gold: This is bullish for gold. Expect safe-haven demand to boost investor appetite for gold as headlines begin to focus on the debt ceiling borrowing limit. The debt-ceiling standoff in 2011 that triggered a run to the then-all-time high in gold prices over $1,900 an ounce and an entrenched political situation would again be positive for gold next year.
The Fed and monetary policy: The Fed meets next on Dec. 13-14 and is expected to hike interest rates again – but at a smaller amount. Currently, Wall Street expects a .50 basis point rate hike, lower than the recent .75 bp hikes.
What it means for gold: This is positive for gold. “A pivot away from the aggressive rate hikes through 2023 should bring new buyers back into the market,” according to a BofA Global Research report. Looking into 2023, BofA Global Research forecasts gold to climb to $2,000 an ounce.
Inflation: The consumer price index (CPI) revealed that inflation eased slightly in October to an annual rate of 7.7%. That is down from September’s 8.2% reading but still remains extraordinarily high. Looking into 2023, inflation is expected to remain high amid continued supply-chain disruptions. Core prices for consumers, which excludes food and energy, are forecast to remain well above the Federal Reserve’s 2.0% target in 2023.
What it means for gold: This is positive for gold. A stronger dollar held back to gold in 2022 as the Fed’s aggressive interest rate hikes this year boosted the currency. However, expect the Fed to pivot on its interest rate campaign as U.S. economic growth weakens, which will open the door for gold to move sharply higher in the weeks and months ahead.
Want to read more? Subscribe to the Blanchard Newsletter and get our tales from the vault, our favorite stories from around the world and the latest tangible assets news delivered to your inbox weekly.
A Gold Investor’s Playbook to Survive and Thrive During Market Manias and Bubbles
Posted onIt’s human nature to want more. It’s also human nature to not want to miss out.
Students of financial markets history are well aware that, going back hundreds of years, market manias or bubbles, occur time and time again. What is a bubble? A bubble is an increase in asset prices based more on emotion than fundamentals. Bubbles form because of human psychology. But, it’s important to point out that bubbles also form because of Federal Reserve money printing, or easy monetary policy – which helps to inflate the bubbles.
Why do bubbles pop? In recent market history – Federal Reserve monetary policy tightening like we are seeing now in 2022 – has caused bubbles to pop. Here are a few examples.
The Nifty Fifty Bubble. A U.S. stock market bubble formed in the mid-1960s led by the so-called “nifty 50,” these were 50 large-cap stocks on the New York Stock Exchange that investors flocked to because of their high returns. For five years up until 1972, the nifty fifty stocks returned nearly 28% per year and over 43% in 1972. That compares to S&P 500 returns averaging about 6.7% for those five years, and a return of just under 19% in 1972.
Why did this bubble pop? The Fed began hiking interest rates aggressively to combat inflation.
U.S. Housing Bubble. During 2001, the Federal Reserve cut interest rates 11 times, pulling the benchmark rate down to 1.75% from 6.00%. This opened the door for one of the greatest housing booms in American history. From 2002 through 2005, housing prices across our nation skyrocketed as homeowners and builders took advantage of ultra-low rates. The housing bubble grew more complex as institutional players got involved with risky and complicated investments based on mortgage-backed securities.
Why did this bubble pop? As the Fed began to hike rates throughout 2005-2007 that deflated the housing market, which only worsened with the 2008 financial crisis.
Cryptocurrency Bubble. The debate is still out on whether the current cryptocurrency market is indeed actually a bubble and we won’t take sides on that issue here. There is still a case to be made for blockchain technology and the future of fintech. However, many cryptocurrency investors in 2022 sustained devastating losses, depending on when they bought into the market. Bitcoin prices are currently hovering around $16,500, that’s down from over $64,000 in November 2021. Like other examples, the Fed raising rates in 2022 has had an impact derailing the massive gains in the crypto market.
U.S. Stock Market. There are many who argued that the broader stock market itself was in a bubble during the multi-year run-up into the January 2022 high – fueled by years of the Fed’s near zero percent interest rate policies. Now, here we are – after six interest rate hikes in 2022, the S&P 500 is down 16% and the NASDAQ composition index is down 29%.
Your Playbook to Surviving Bubble Booms and Busts
Emotions are part of investing. When it comes to bubbles, investors learn a hard lesson about speculation. There’s nothing wrong with speculation. A lucky few can get rich that way. However, when you are speculating you can lose up to 100% of your investment.
The path to long-term wealth building may not be sexy, but it is a proven method, and that includes diversification into non-correlated assets like physical gold and silver. Throughout history, gold has served investors well – acting as a safe-haven investment and store of value. Portfolios that include an allocation of gold perform better than those without. If you want to speculate with a small portion of your portfolio, recognize it for what it is – speculation.
Conversely, when you buy physical gold you are investing in a proven asset that has been a store of value for thousands of years.
Gold remains one of the best-performing asset classes in 2022 – down 5%. Compare that to the 16% decline in the S&P 500, the 29% decline in the NASDAQ composite index, and the 13% decline in the iShares Core U.S. Aggregate Bond ETF (AGG), which tracks the U.S. investment grade bond market.
The Fed isn’t done hiking interest rates. That means the stock market bubble from the past several years isn’t done deflating. Stocks have further fallen and gold has been climbing over the past month. Before the stock bubble pops even more – consider using current market levels to protect your wealth with an increased allocation to gold.
Want to read more? Subscribe to the Blanchard Newsletter and get our tales from the vault, our favorite stories from around the world and the latest tangible assets news delivered to your inbox weekly.
Lessons from History: High Inflation Can Last a Decade
Posted onIs the inflation crisis over? When the government reported the October consumer price index (CPI) rose by 7.7%, slightly less than expected – the Dow Jones Industrial Average soared 1000 points on the news.
Despite the stock market’s jubilant reaction, the inflation fight is far from over, according to a new research paper.
Consider this.
- Before the October CPI reading, that inflation measure registered 8% or higher for seven consecutive months.
- The annual CPI hit 9.1% in June, marking the largest advance since November 1981.
- Overseas, the British just saw news that U.K. October CPI inflation hit a new 41-year high at 11.1%.
- The Federal Reserve’s inflation target stands at 2%. So, the October CPI is still 5.7% higher than the central bank’s goal.
While the stock market day traders pressed the “Buy” buttons on their online trading platforms the day CPI was released, history shows us that inflation is not that easy to erase.
High Inflation Historically Lasts 10 Years
New research shows that when year-over-year inflation climbs above 8%, like we saw for seven months in 2022, it doesn’t recede quickly, according to a paper from Rob Arnott, Research Affiliates founder and Omid Shakernia, a partner at the firm who leads its multi-asset strategies.
Their research found that inflation above 8% means that inflation tends to accelerate 70% of the time. Using data from 14 advanced economies going back to January 1970, they found the median time it took for those 14 economies to get inflation back down under 3% was 10 years. That’s right a full decade.
Don’t expect inflation to just quietly go away in 2023.
Inflation is now broad based across both goods and services in our economy. Once consumers are paying higher prices for these items and services, companies don’t just cut their prices. Why would they? Higher prices are more profitable for the companies. Giant corporations are now making record profits on the heels of increasing prices.
Here’s what CEOs have said recently on their earning calls.
Kroger CEO: We view a little bit of inflation as always good in our business, and we would expect to be able to pass that through.
AutoZone CEO: And as I’ve said before, you know, inflation has been a little bit of our friend in terms of what we see in terms of retail pricing.
Hostess CEO: We’re also seeing the consumers experience a lot of disruption. And they haven’t fully recognized there were absorbed pricing.
Wages have been rising. This has the potential to keep inflation on an upward trend.
In the second quarter, wages jumped 5.1% annually. Sure, that is below the inflation rate but worker pay is growing at the fastest clip since the data reporting began in 2002.
What does this mean? Economists call this a wage-price spiral. It’s like a feedback loop. A wage-price spiral is when higher prices cause workers to ask for higher wages, which in turn increases costs and pushes prices still higher, setting off a recurring loop of events.
Money velocity is moving higher. After falling for 25 years, money velocity has turned higher.
What is money velocity? Here is how the St. Louis Fed defines it:
“The velocity of money is the frequency at which one unit of currency is used to purchase domestically- produced goods and services within a given time period. In other words, it is the number of times one dollar is spent to buy goods and services per unit of time. If the velocity of money is increasing, then more transactions are occurring between individuals in an economy.”
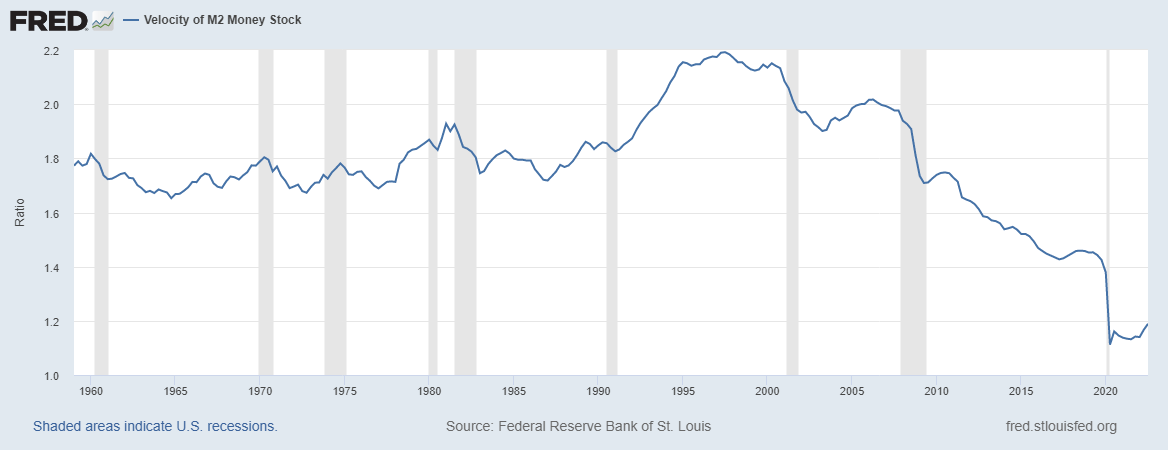
“Higher rates usually pushes velocity up as consumers look for opportunities to deploy their cash. Recently, we have seen an acceleration in money velocity. If this continues, inflation might remain elevated even if money supply falls,” Carlo Putti, fixed income investor director at the fund manager M&G told MarketWatch.
What does this means for gold?
History shows us that high inflation is likely here to stay for years. In 1979-1980, inflation was growing out of control and the Fed had simply lost its grip on controlling inflation. Then, gold skyrocketed to about $850 an ounce, equal to more than $3,000 today.
History is now repeating itself. Fed literally sat on its hands during 2021, failing to act, while inflation climbed to 7%, a 39-year high. The central bank is raising rates now – but once inflation gains traction it’s hard to eradicate as history shows.
As the economy slows and inflation remains high, gold historically has been one of the best-performing assets. At Blanchard, we recommend investors allocate 10-15% of their investment portfolios to gold. If you haven’t yet, consider doing it soon.
Want to read more? Subscribe to the Blanchard Newsletter and get our tales from the vault, our favorite stories from around the world and the latest tangible assets news delivered to your inbox weekly.
5 Very Valuable Key Date Coins
Posted on — 3 CommentsDo you own any key date coins? If you do, you understand the feeling of triumph, pride and excitement of adding a key date coin to your collection. Key date coins are those with a low mintage or with mintages having few survivors, and they are prized in the world of numismatics.
The performance returns of key date coins have historically outpaced gold bullion and other rare coin markets. It comes down to supply and demand. Key date coins are one of the scarcest markets in all of tangible assets. At the same time, they offer all of the intrinsic benefits of gold. While key date gold coins are more expensive than common date rare coins, their excellent historical performance has more than justified the purchase price for countless numismatic investors.
Let’s dive in and explore five of the “rarest of the rare” key date coins in the numismatic world.
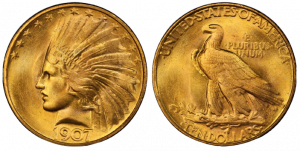
1907 $10 Rolled Edge Indian Head
The United States Mint struck Indian Head Eagles — a $10 gold piece — regularly from 1907 until 1916, and then irregularly until 1933. However, numismatists covet the 1907 $10 Rolled Edge key date of this spectacular series.
The obverse and reverse were designed by Augustus Saint-Gaudens, considered by many to be the greatest modern sculptor known today.
The Rolled Edge variety was actually struck in rather large quantities for circulation, but they were melted before ever being released to the public. The surviving examples are mostly high quality and were either saved as assay pieces or obtained directly from the Mint prior to the decision to melt the issue.
Experts believe that a mere 40 to 45 specimens exist today. Owning one of these coins would be a treasured highlight for any numismatic’s’ collection.
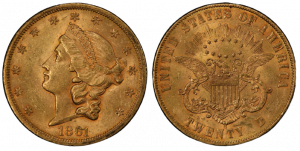
1861-S Paquet $20 Liberty Head
The 1861-S Paquet $20 Liberty Head coin exists today because of slow communication between Philadelphia and San Francisco that year. As the story goes, Anthony C. Paquet, assistant U.S. Mint engraver made a new design for the $20 Coronet Liberty Double Eagles. However, it was determined that his new design (tall lettering and a very narrow rim) wouldn’t wear well.
A telegraph was sent to the San Francisco Mint ordering a return to the James Barton Longacre style. Apparently, the telegraph was not transmitted quickly.
By the time the news reached the San Francisco mint, $385,000 worth of the new reverse 1861-S Double Eagles had been struck and released into circulation!
The 1861-S Paquet key date is truly the rarest Liberty Head Double Eagle produced by the San Francisco Mint. It would indeed be an incredible achievement to add one of these coins to your collection.
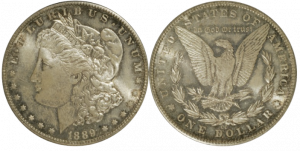
1889-CC Morgan Dollar
This key date coin can in part be attributed to the presidency of Democrat Grover Cleveland. President Cleveland strongly opposed the coinage of silver dollars, and in 1885 the Carson City Mint was closed for coinage operations.
The Carson City Mint received a new lease on life with the election of Republican Benjamin Harrison as president at the end of 1888. When the Mint reopened in the third quarter of 1889, crews had to clean the offices and machinery before production could begin. As a result, the Mint only had time to produce 350,000 coins in 1889, and all of these coins came out in the last three months of the year. The 1889-CC Morgan dollar was one of the lower mintage issues of the entire series.
To make these coins even scarcer, an estimated 250,000 to 325,000 1889-CC Morgan Silver Dollars were melted — for reasons that are unclear today. While the mystery remains, that ensured the 1889-CC Morgan is a key date for any Morgan Dollar collector.
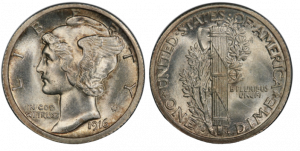
1916-D Winged Liberty Dime
Commonly known as the Mercury dime, the Winged Liberty Head dime is one of the most popular U.S. coins in numismatic history. How shall we put it? The dime was not one of the Denver Mint’s priority denominations — and so begins the story of how this key date coin emerged.
In late November 1916, the Denver Mint received a large rush order for 4,000,000 Barber quarters. In order to meet that order, the Denver Mint immediately halted the production of dimes. At that time, only 264,000 Mercury dimes had been struck.
Thus, a legendary key date issue was born. These few coins were primarily distributed in Montana and the Upper Midwest that November. At that time, there were not many active coin collectors in that geographic region, which meant most survivors saw extensive circulation before they were found by numismatics.
The very significant 1916-D Mercury Dime specimen is highly sought after and would be a standout achievement for any investor to add to their personal collection.
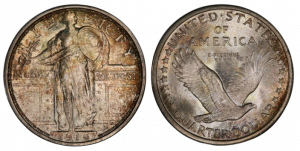
1916 Standing Liberty Quarter Dollar
The 1916 Standing Liberty Quarter Dollar boasts one of the lowest mintages of any coin struck for circulation during the 20th century.
The 1916 Standing Liberty Quarter is the first issue in the series. These coins were not produced until the last two weeks of 1916 and were released in January 1917. The mintage is extremely low — only 52,000 coins, making this issue the lowest mintage by far in the Standing Liberty Quarter and the key date.
Today? It is estimated that only 500 specimens remain in grade 60 or higher, with a mere 50 in grades 65 or better.
The Bottom Line
Key dates are often a focus for advanced rare coin investors. They seldom surface in the marketplace and when they do, they don’t stay on offer for long. Demand is always strong for these legendary key date coins.
Do you have a key date coin? Are you looking for a key date coin? Contact the numismatic experts at Blanchard!
Want to read more? Subscribe to the Blanchard Newsletter and get our tales from the vault, our favorite stories from around the world and the latest tangible assets news delivered to your inbox weekly.
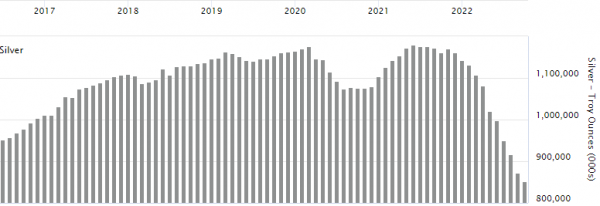
Silver Jumps As Metal Held in London Vaults Sinks to Record Low
Posted on — 1 CommentThe price of silver jumped to a 4-month high this week fueled by massive investor demand for the metal. This investor demand for silver is now draining  the London vaults of their silver holdings – which fell to a record low in October, according to the London Bullion Market Association (LBMA).
In a year where Americans have faced shortages from items like baby formula to certain prescription drugs to gasoline, silver supplies are now running tight.
The amount of silver stored in London vaults slid to 26,502 tonnes of silver, a 2.2% decrease versus previous month and a record low, according to LBMA. That silver is valued at $16.3 billion, which equates to approximately 883,417 silver bars.
 =
=
Investors from the U.S. and Germany to India Are Buying Silver
Strong demand is driving the reduction in London silver holdings. “The decline reflected the ongoing strength of coin and bar demand, especially in the key U.S. and German markets,” Philip Newman, the Managing Director of Metals Focus said.
It’s not just the Americans and Germans that are snapping up silver coins and bars this year. In India, silver consumption is forecast to increase by around 80% to a record this year, Bloomberg reported this week.
“Indian October imports appears to have still been sizable, albeit considerably lower than September’s near record high of 1,700t. The lower total for October may reflect the impact on the Indian market of higher rupee prices earlier last month. Our Mumbai team noted that silver demand eased somewhat during Diwali, in contrast to gold, which enjoyed double-digit gains during the festival,” Newman said.
Precious Metals Demand Surges in 2022
Around the globe, investors are turning to both gold and silver as a safe-haven investment in 2022 amid rampant decades-high inflation, rising interest rates and falling stock and bond markets. Gold demand is also rising, with a 28% jump seen in the third quarter, according to the World Gold Council.
The amount of gold stored in London vaults also fell last month. At the end October, the amount of gold held in London vaults stood at 9,308 tonnes, a 1.4% decrease on previous month. That is valued at $490.5 billion, which equates to approximately 744,662 gold bars, the LBMA reported.
The LBMA’s physical metals data includes the holdings of the London commercial vaults and the Bank of England’s gold holdings. The Bank of England does not currently hold silver. These figures provide an important insight into London’s ability to underpin the physical OTC market.
Silver Poised to Move Even Higher
What does this mean for silver prices ahead? “Silver is well positioned to continuing moving higher, underpinned by investor strong coin and bar demand,” said David Zanca. Senior Portfolio Manager at Blanchard. As supplies become tighter, the price will rise.
It’s not just furniture or appliances that have long wait times for delivery today, in India, metals investors are seeing wait times for sourcing the silver move sharply higher, with suppliers taking about 20 days to dispatch an order, Bloomberg reported.
Where Is Silver Heading?
The price of silver climbed to $21.82 on Thursday. The white metal is climbing out of a consolidation and basing phase that unfolded in recent months, which confirms a strong bottom in place. Looking higher, the first target for silver lies at $22.50 area with the $26.50 and $27.50 levels as a major multi-month objectives.
Supplies of silver have been getting tighter in recent months, which will continue to support higher prices as investors seek safety from the double-digital declines in paper assets seen in stock and bond markets this year.
This sharp drawdown in silver stocks reveals the on-going shortage economy Americans are navigating through today. Precious metals are an investment that acts as a store of value to preserve, protect and grow your wealth and – big and small investors are adding coins and bars to their portfolio. Consider trading some of your dollars, which are losing purchasing power to inflation into American Silver Eagles coins or Silver bars today.
Want to read more? Subscribe to the Blanchard Newsletter and get our tales from the vault, our favorite stories from around the world and the latest tangible assets news delivered to your inbox weekly.
Cashing In On Controversy: The Strange History of the 1909-S VDB Lincoln Cent
Posted on — 8 CommentsNever before have three little letters meant so much.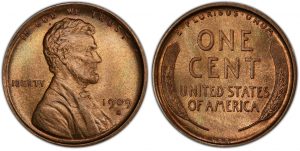
The 1909 Lincoln cent – designed to replace the Indian Head penny – was welcomed by Americans with enthusiasm, before quickly being discontinued due to one small detail.
Then President Theodore Roosevelt believed that US coins needed new imagery that would inspire Americans. At this same time, he found himself intrigued with the work of Lithuanian-born artist, Victor David Brenner. While meeting with the artist to have his portrait painted Roosevelt noticed Brenner’s relief sculpture of Lincoln and was instantly impressed.
He was not only taken with the quality of the work but also the subject. Roosevelt had long revered Lincoln and considered him a hero. Around this time Roosevelt got the idea to design a new penny showing Lincoln in Brenner’s style. The timing was perfect as Lincoln’s 100th birthday was approaching. This would be the first everyday US coin to feature a person who existed.
By August of 1909 the coin was ready to be released to an eager American public. Long lines formed as enthusiastic collectors waited for their turn to buy the coin. Part of this excitement may have come from pent-up demand as the pennies were to be released in June, but then were delayed when President Taft demanded that the words “In God We Trust” be included on the coin above Lincoln’s head. Americans loved the design.
But one man didn’t.
That man was Secretary of the Treasury Franklin MacVeagh. After the coin was released to the public he became aware of one small detail that he didn’t recognize earlier: the artist’s initials, “V.D.B.” appeared at the bottom of the reverse. He didn’t like this decision.
Just four days after the coin was released the Washington Post published an article announcing that the coin was doomed due to this one design element. Soon after, there were reports of Americans rushing to buy more Lincoln pennies because they knew they would soon be unavailable and might grow in value due to scarcity.
The first wave of last-minute buyers were newsboys who were the first to see the announcement. It was not long before the discontinued Lincoln pennies were fetching 25 cents a piece. By November of 1909 all of the minted “V.D.B.” coins were in the possession of the public.
Officials redesigned the dies to omit Brenner’s initials. Eventually the mint reversed this decision and in 1918 they put Brenner’s initials back on the coin. This version placed the letters on the obverse below Lincoln’s shoulder.
In total, the Philadelphia Mint produced 27,995,000 VDB pennies and the San Francisco Mint produced only 484,000 making those in the series particularly valuable.
Today the coin remains a key focus for collectors. As recently as 2019, a VDB penny graded MS67 sold for just over $50,000.
For many, the piece represents more than rarity, it also represents a new era in US coins when the real life figures of the nation’s history were elevated to a new status.
Want to read more? Subscribe to the Blanchard Newsletter and get our tales from the vault, our favorite stories from around the world and the latest tangible assets news delivered to your inbox weekly.
The State of Economy and Gold: U.S. Not Out of the Woods Yet
Posted on — 1 CommentGold has served as money and a store of value for thousands of years and it’s no surprise that demand for gold is rising in the current environment with record high inflation, rising interest rates, climbing U.S. debt levels and the potential for a recession. Indeed, in the first half of 2022, gold demand climbed by 12% year-over-year, according to the World Gold Council.
Let’s take a deeper look at the state of the U.S. economy and what it means for gold ahead.
Housing Market Is Slowing: Spillover Impact
In September, the pace of new single family homes sales tumbled by 10.9%, the Commerce Department reported. Thirty-year mortgage rates more than doubled in 2022 and now stand north of 7%, which is choking off buying interest and slowing home sales.
Why do home sales matter to economic growth? Consider this. When you buy a new home, you also usually buy new furniture, maybe some new appliances and items like lawn mowers and snow blowers, which spills back into the economy and drives economic growth forward. Thus, when the housing market slows, it is a contributor to slower overall economic growth.
- Across the U.S., the National Association of Realtors (NAR) estimates that each home sale at the median generated about $113,000 of economic impact in 2021.
- The NAR estimates that every home sale generates two jobs.
A deteriorating housing market, alongside troubling inflation levels and an aggressive Federal Reserve, place the economy on unsure footing for 2023.
Gross Domestic Product Growth
The latest GDP report revealed that the U.S. economy grew 2.6% in the third quarter, following the second quarter’s negative 0.6% decline. Improving export sales helped fuel the better-than-expected report. However, digging inside the data reveals a mixed view as consumer spending on goods fell for the third straight quarter – which reveals that the record high inflation is taking a toll on American’s everyday spending.
Yes, Inflation Still Rising
New reports on inflation show that prices are still climbing at a brisk pace. The widely watched Personal Consumption Index jumped 6.2% through September, while the U.S. Consumer Price index gained 8.2% in September.
Fed Still On Track to Raise Rates Again
The Federal Reserve already hiked interest rates five times in 2022 and is on track for another super-sized .75 basis point rate hike in early November. While third quarter GDP managed to trend higher, the fourth quarter and 2023 may not be so lucky if the Fed keeps its pedal on pushing rates higher – punishing Americans who are borrowing to buy homes, cars or even those with consumer debt.
Americans are getting hit on multiple fronts with the stock market careening lower, home prices falling and the price of consumer goods at a 40-year high. Inflation is destroying the purchasing power of your wealth and savings, while the value of financial assets including stocks and bonds is falling sharply this year.
What This Means for Gold
Gold demand is expected to remain high in this environment as investors look for safe havens in the current economic storm. While precious metals have slipped slightly lower, gold remains one of the best performing asset classes in 2022.
Peering just around the corner, with inflation stuck at 40-year highs and the potential for a recession looming, the macro situation is ripe for what economists call: “stagflation.”
Gold, it turns out, is the best stagflation performer since 1973 with a 12.8% annualized return, according to a Gold Hub investment update. At Blanchard, we recommend investors allocate 10-15% of their investment portfolios to gold. If you haven’t yet, consider doing it soon.
Want to read more? Subscribe to the Blanchard Newsletter and get our tales from the vault, our favorite stories from around the world and the latest tangible assets news delivered to your inbox weekly.