The Blanchard “Test Your Coin IQ” Quiz
Posted on — Leave a commentWelcome coin investors! The history of coins and money is fascinating. Test your coin IQ with the questions here. Let us know how you did in the comment section below!
- What is the first commemorative coin in U.S. history?
Answer: The 1892 Columbian Exposition half dollar was minted to commemorate the World’s Columbian Exposition, also known as Chicago’s World Fair. These half dollars with a face value of 50 cents were sold for $1 to help cover the spiraling costs of the World Fair. With a fairly high mintage, only a few coins of high grade quality show outsized value. The average auction price for all years of the coin is around $613, according to the NGC.
Coin details: The obverse design features Christopher Columbus in profile. The reverse features the Columbus flagship, the Santa Maria, and two globes. The Reverse Inscription includes: WORLD’S COLUMBIAN EXPOSITION, CHICAGO, 1492, 1892.
- What commemorative coin boasts the Italian phrase: “Fatti Maschii Parole Femine”?
Earn extra credit if you know the translation.
Answer: The Italian phrase translates to “Deeds are manly, words womanly” and is the Maryland state motto. That phrase appeared on the 1934 Maryland Silver Commemorative coin.
This coin is an example of a classic U.S. commemorative coin. The 1934 Maryland half dollar was issued to celebrate the 300th anniversary of English colonist’s arrival in the state Maryland. About 300 English colonists arrived aboard two ships (the Ark and Dove) in 1634 to settle in the area that is now Maryland. Lord Baltimore George Calvert held the Royal Charter for that land. Notably, this coin is one of the first commemoratives struck after the start of the Great Depression in 1929. Struck at the U.S. Mint in Philadelphia, the mintage totaled 25,000.
You can own this coin for as little as $231.00.
Coin details: The obverse of the coin features a portrait of Cecil Calvert, or Lord Baltimore, who sponsored the colonists. The reverse of the coin features the coat of arms of Maryland with the phrase: Fatti Maschii Parole Femine. Additional inscriptions include “Maryland Tercentenary” and the dates “1634-1934”.
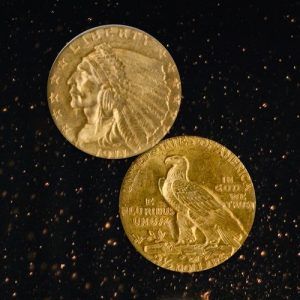
- What gold coin series used an “incuse design” (not a raised design).
Hint: The obverse features a male Indian chief with a large ceremonial headdress.
Answer: The Indian Head Quarter Eagle with a face value of $2.50 was introduced in 1908 and minted through 1929. It is noteworthy for its incused design: the lettering is sunk into the flat plane of the coin. This revolutionary sunken design concept is credited to a Boston physician: William Sturgis Bigelow, a friend of President Teddy Roosevelt. Grading of these coins is considered difficult as the incused design does not show much wear.
The coins were popular Christmas gifts in the late 1920’s and remain extremely coveted by collectors today.
Take a look at a few examples here.
Coin details: Bella Lyon Pratt crated the design which features a Native American Indian Chief on the obverse and an eagle facing left on the reverse. The 1911–D mintage totaled 55,680 and is considered the “key date” of this series. The survival rates are low, which increased the rarity value of these stunning 1911 coins.
The last coin was struck in 1929 as the Great Depression hit. The 1929 mintage totaled 532,000. Most 1929 examples are nicely struck with great luster even today. However, this date is notable for more than average bag marks. Perhaps once the Great Depression hit, the movement of gold coins slowed significantly.
If you enjoyed this article, please let us know at 1-800-880-4653.
Read More:
Trivia Questions For Coin Collectors: Do You Know The Answer?
Beyond Bullion: The Beauty and Allure of Pre-1933 Gold Coins
The Hidden Cost of Economic Growth and Rising Stocks
Posted on — Leave a commentEconomic growth is good and stocks are rising. Everything’s rosy, right?

Once you dig beneath the surface and look at what’s fueling the growth, it’s easy to see the high cost Americans are paying for this growth.
This story started about 10 years ago…
Since the 2008 global financial crisis, the Federal Reserve fueled a massive bull cycle in the U.S. equity market through extraordinary low interest rates. That low-interest era is winding down as the central bank slowly hikes interest rates.
For years, Wall Street traders and money managers took advantage of the “punch bowl” of low interest rates, which fueled rising stock prices in what many called a “bubble.”
While the Fed removes the proverbial punch bowl from the stock market, the Administration stepped in with another substitute late last year.
Monetary to Fiscal Policy
The baton passed from monetary policy to fiscal policy to drive short-term economic growth and stock prices.
- A word to the wise. The abnormally low interest rate environment was not without costs to the economy, which has still not fully recovered or returned to normal interest rate and inflation conditions.
- Fiscal policy stimulation also has its costs, and they could prove more devastating economically in decades to come.
How does fiscal policy boost stocks? Last year’s tax cut included the biggest corporate tax cut in American history.
- Most companies saw their tax rate drop from 35% to 21%.
The huge corporate tax cuts increased many publicly traded companies price/earnings ratio. That means their earnings went up as their tax rate went down.
Did the company produce any more widgets? Or, were the company’s actual revenues increased? No. The P/E ratio looks better because most company’s see greater earnings because of lower taxes.
At What Cost?
Number one: a huge increase in the U.S. debt and deficit.
The U.S. took on a big amount of debt to pay for those tax cuts and a little bit more economic growth now.
Simply put, policymakers made a trade. They traded bigger deficits for you and your kids in the future for a little bit more economic growth and rising stock prices at the end of the current old and tired expansion cycle.
Policymakers kicked the can down the road, taking a little bit of “good” now for what could turn out to be a lot of bad later.
Here’s a look at the numbers. The Treasury racked up a record amount of debt in the first three months of 2018, borrowing about $488 billion, or $47 billion more than initial estimates, according to a recent Newsweek article.
Here’s what makes this new debt even more worrisome:
“As the U.S. takes on these unprecedented levels of debt during economic boom times, a potential crisis looms: Foreign investment in U.S. debt is currently at its lowest point since November 2016 and has been decreasing steadily since 2008, when foreigners owned about 55 percent of American debt,” the Newsweek article warned.
Risks Are Rising
While the tax cuts, economic growth and rising stock prices sound good now. The costs are clear.
The costs could include dramatically higher interest rates – perhaps even in the double digits – in the future as America is forced to finance its massive debt amid a world of less-interested takers.
It also leaves less money available for the already burdened Social Security system. In 2037, Social Security is estimated to only have enough funds to pay out about 75% of benefits. Some policymakers now want to slash program benefits to reduce the rising debt burden. That will only hurt everyday Americans, most who already haven’t saved enough for retirement.
There’s Never Been a Better Time to Buy Gold
Once you look beneath the surface and realize the rickety house of cards the current economic growth and rising stock market is built upon, the value and dependability of gold looks better than ever.
Current market conditions offer investors a rare opportunity to protect their wealth and insure their future with physical gold. While you can’t control what the government does, you can control you own financial future. Buying physical gold now could be an invaluable move to protect and preserve your financial security in the future, which looks more uncertain all the time.
Don’t fight the Fed: What it means for gold investors
Posted on — Leave a commentYou may be familiar with an old market saying: “Don’t Fight the Fed.”
Since the Federal Reserve bumped interest rates higher at its meeting today – tugging the fed funds rate to 1.75-2.00% – it’s valuable to consider the true meaning of that statement.

Warning! Dial Back on Stock Exposure
“Don’t fight the Fed” is a recommendation to stock investors to “pare back” on stock holdings as the central bank pushes interest rates higher. Why?
- The Fed hikes interest rates toward the end of a business cycle to prevent overheating (inflation).
- Historically, that precedes a bear market in stocks and a recession in the economy.
Essentially – Don’t Fight the Fed is a warning to stock investors – get out while the going is good!
- That may be truer than ever today! The current U.S. economic expansion cycle turned 9 years old in May. That is the second-longest expansion going back to the 1960’s.
What It Means for Gold
But, interest rates are going higher isn’t that bad for gold? Nope. Not now. Here’s why.
There are extremely low odds the Fed will truly be able to “normalize” its monetary policy before the next recession hits. Interest rates have been historically low for a DECADE now – since the 2008 global financial crisis. There is nothing normal about these conditions.
Higher interest rates are bad for stocks (it makes everything companies buy on credit cost more). When stocks turn down, history shows time and time again, that gold prices turn up – usually significantly.
Gold climbed 179% from the 2008 low into the 2011 high. We are getting close to the tipping point in that cycle now.
- Don’t Fight the Fed means a bear market and recession could be just around the corner.
This is a rare opportunity to accumulate gold – perhaps one of the safest assets known to mankind at a relative bargain price. Buying gold coins and bars is one of the best way to protect your assets at this point in the business cycle.
The Fed is making moves. Are you? Call Blanchard today at 1-800-880-4653 to take steps to protect your assets.
A Stir in China: Rising Demand for Gold
Posted on — Leave a commentIn recent months something has reinvigorated China’s demand for gold. In fact, 2017 was the first year since 2013 in which China experienced a growth in jewelry demand. This increase marks a reversal of a worrisome trend that began just a few years ago.

Recently, the World Gold Council reported that demand for gold in China shrank by one-third between 2013 and 2016. What precipitated this drop? Decreasing gold prices drove accelerated buying. However, this fervor led to an over supply. Stores appeared everywhere. Merchandise piled up. This trend gave rise to price wars in which purchases fell with each year representing less than the one before. Despite the signs of a classic supply and demand problem, there was another underlying culprit to the downfall.
Too many sellers mistakenly believed that consumers only wanted gold jewelry for its valuable metal. Retailers accepted consumers as a purely pragmatic group. As sales dropped, merchants were forced to rethink their assumptions. They began understand that consumers want style. In time, retailers began to offer a wider array of gold products thereby appealing to the consumer’s aesthetic leanings.
This concept makes intuitive sense. Increasingly, China’s economy is driven by middle-class consumers. This group is seeking luxury goods. As more people enter the middle class the demographic is changing. More younger consumers populate this tier than ever before. This change means that sellers have had to expand beyond traditional 24ct products which appeal more to an older demographic.
Younger buyers want 18ct and 22ct gold which is considered, in China, more fashionable and is also more affordable. These lower ct offerings give the jewelry a distinct color that is more in keeping with younger tastes. This diverse product selection is the ultimate win-win. As the World Gold Council explains, “these products offer fatter profits for retailers. 24ct jewelry is usually sold by weight, with slim margins. K-gold is sold by piece, which allows the retailer to boost profit margins.”
Technology has also entered the picture. Makers now have the capability to use a chemical process to manufacture “3D” gold which is up to four times harder than 24ct gold while using only one-third of the amount of gold found in a traditional piece of jewelry that is the same size. Manufacturers and artists have designed new pieces that resonate with the growing consumer base.
Retailers are wise to react swiftly to changing times. Research shows that more than three-quarters of the urban population in China is expected to be middle-class by as soon as 2022. Consider that in 2000 only 4 percent of the urban population was middle class. These new households have greater income and more disposable wealth. Not surprisingly, spending from this group is projected to increase by 9 percent per year through 2020.
These figures illustrate opportunities not only for gold sales in China, but also for gold investors in the U.S. As demand increases, prices will rise and investors will be poised to capitalize on the rising tide.
What the Emerging Global Middle Class Means for Gold
Posted on — Leave a commentTo understand the future of gold you need to look at where the action is, and experts agree, the action is in emerging economies. Emerging markets are important when forecasting gold demand because these are the regions positioned to see the greatest population growth over the next decades. Research from Brookings projects that within the next 17 years, approximately 170 million people will enter the middle class every year.

The World Gold Council (WGC) suggests that the engine of this growth will be technological growth, institutional reform and organizational changes. People lead this change; therefore, demographic shifts will be critical to spurring the innovation necessary to deliver on these bold population forecasts. For example, the WGC expects the share of citizens to be of working age in Africa will rise from 13% to 40% by 2100 making the country a dominant player on the world stage. Interestingly, these projections don’t reflect the popular belief that China’s status as an economic powerhouse will continue unabated. In fact, they expect the country’s economic growth to shrink by 1% per year starting in 2050.
As the middle class grows, purchasing power grows with it. McKinsey expects that annual consumption within emerging economies to reach $30 trillion. The purchasing power of this group will be staggering. McKinsey continues, “As a result, emerging-market consumers will become the dominant force in the global economy. In 15 years’ time, almost 60 percent of the roughly one billion households with earnings greater than $20,000 a year.”
Middle class growth in these countries has implications beyond gold purchases as a status symbol of conspicuous consumption. Governments will likely increase their demand for the metal as technological developments increase. The same body of research shows that China’s commitment to technology will account for 50% of its economic growth by 2030. Gold will continue to be a major component in technological devices like tablet computers and smartphones snapped up by a growing base of voracious consumers. This trend will present an interesting phenomenon in which more people have access to technology which, in turn, gives them greater ability to buy gold.
Additionally, investors in many of these countries will opt to store their household wealth in gold. This choice comes from a long-standing belief that gold is a safer store of wealth than local currency or financial instruments like stocks and bonds. As globalism continues to advance, more citizens are likely to choose gold because it is valued and respected around the world unlike many paper currencies.
Moreover, citizens of developed countries are also likely to opt for gold more than they do today. Why? Because as emerging economies become more established there will be less variance between emerging market and developed market equity funds which will only spur investors to seek diversification in other areas like precious metals.
The emergence of a more populous middle class will be a significant influence over the future of gold and investors who seek to capitalize are starting to invest now.
U.S. Mint Gold Coin Sales Surge By 433% In May
Posted on — Leave a commentGold coin buying turned frenzied in May, as sales of American gold coins skyrocketed by a stunning 433% in May from April, according to U.S. Mint data.
May gold coin sales marked the highest level since 2015, as investors used the lower price levels as an opportunity to increase physical gold ownership, amid a time of rising geopolitical and economic tensions.
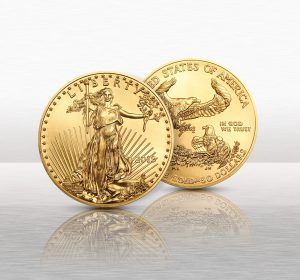
In May, the U.S. Mint sold 24,000 ounces of American gold eagle coins, up from 4,500 ounces in April.
- Premiums, or the different between the gold coin and spot gold prices is historically narrow right now, about 1-1.5%. That creates great buying opportunities for investors.
Spot gold prices slid since mid-April, pressured in part by a rising U.S. dollar and an initial jump in the 10-year Treasury yield. However, 10-year rates have slumped sharply in the past few weeks.
3 Reasons Gold May Have Found a Floor
The recent price dip toward the $1,300 an ounce in gold may be bottoming out. Why?
- Chinese and Indian buyers tend to be “price sensitive,” which means they tend to wait for price retreats to buy. The $1,300 an ounce level in gold is viewed as a good buying opportunity, which should attract physical buying from these two gold hungry nations.
- The U.S. dollar is expected to fall back, which in turn, should help gold prices recover. One factor that could weigh on the U.S. dollar are the rising concerns over the economic impact of a Trade War, which could derail expectations for a couple more Federal Reserve interest rate hikes in 2018.
- Increased interest in gold as an inflation hedge.S. inflation data and more importantly future inflation expectations have steadily increased since the start of the year. That increases demand for gold to hedge against the corrosive impact of higher prices on goods and services. Gold typically climbs during periods of rising inflation, which helps to protect purchasing power of one’s assets.
Bottom Line
The swift jump in American Eagle gold coins during May could just be a taste of what’s to come this year. Professional money managers turn to gold during times of economic uncertainty, crisis and rising inflation. The 2018 run toward gold may just be getting started. Is your portfolio fully protected?
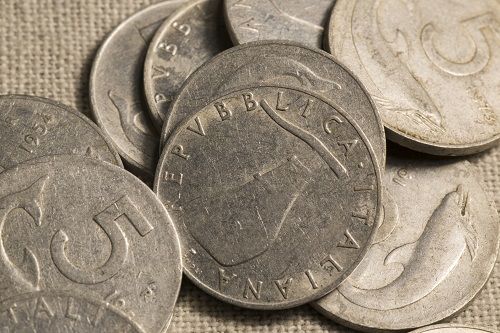
What Does Italy Mean for Gold?
Posted on — Leave a commentRecently, gold prices have dropped due to fears surrounding political turmoil arising from Italy. Equity markets around the world have followed this same trend. The trouble began on Sunday when the President of Italy, Sergio Mattarella, blocked the appointment of the finance minister. Mattarella remarked that his decision surrounded “The uncertainty over our position in the euro.”
Concerns are growing as this decision marked the 84th day of Italy without a government. Moreover, the country is drowning is debt which now totals 2.1 trillion euros with more added daily. Historically markets have seen gold prices rise in uncertain times as the urge to retreat to “haven” investments increase. However, each scenario is a little different and as Edward Meir, a consultant at INTL FC Stone explains, “The stronger dollar seems to be offsetting the bullish impact coming out of Europe.” Now, the Euro is falling in value. This drop makes U.S.-traded commodities like gold more expensive for international investors. The one haven investment that’s increasing in value is the U.S. Treasury bond.
Trepidation isn’t limited to Italy. Many investors fear trouble in that country could pervade Europe. Meanwhile, sell-off fears are rising as more investors become less confident in the global political leaders of today. Perhaps this diminished trust is why “Gold has been behaving exceptionally well when measured across various major currencies, and it continues to maintain an uptrend against the U.S. dollar as well,” explained one portfolio manager at Sprott Asset Management.
More voting will likely occur this fall. However, investors aren’t excited about the event. Many fear that the ballots will strengthen the anti-Eurozone mood and ultimately lead to a fracturing of the currency. This outcome would wreak havoc on global financial markets. Equities and many bonds would fall in value as earning potential and confidence in credit worthiness decline.
In such a scenario gold offers a greater likelihood to preserve one’s wealth or even expand it. The problem, however, is more than Italy. Their exit from the Euro would likely precipitate other countries doing the same. Savvy investors might find clues to the future of gold in this scenario with a look to the not-too-distant past.
In the fourth quarter of last year we saw Catalonia’s parliament declare independence. This act was one of defiance in the face of the Spanish government. This event is a useful case study for investors facing Italy’s dilemma because “Catalonia is a small microcosm of the total European situation. But what it represents is the idea of an unstable European Union,” explained Dan Hussey, senior market strategist at RJO Futures in Chicago. Shortly after this move, gold prices increased.
Seasoned investors understand that the only certainty is uncertainty. Italy and Europe is top-of-mind for many at the moment. While this narrative unfolds, others are almost certainly beginning to take shape and in such early stages of development that we don’t see them. For this reason, gold remains an enduring investment that kicks into gear when you need it to.
Beyond Bullion: The Beauty and Allure of Pre-1933 Gold Coins
Posted on — 1 CommentIn 1904, President Theodore Roosevelt was a man on a mission.
Intent on improving America’s image world-wide, Roosevelt was preparing the United States Navy battle fleet for an ambitious journey around the globe that began in 1907.

Nicknamed the Great White Fleet, 16 U.S. battleships made friendly goodwill visits to numerous nations around the world, while simultaneously showcasing the naval power and might of America.
President Roosevelt, well-schooled in the gorgeous high-relief designs on ancient Greek coins, decided that America needed better coins to represent the country on the world-wide naval tour. Roosevelt aimed to upgrade the coinage that would be utilized on the sea journey.
Roosevelt: U.S. coins are “hideous”
Roosevelt wrote to the Secretary of the Treasury lamenting: “I think the state of our coinage is artistically of atrocious hideousness. Would it be possible, without asking permission of Congress, to employ a man like (Augustus) Saint-Gaudens to give us a coinage which would have some beauty?”
As luck would have it there were five coin series that the President was authorized to change without Congressional approval. One of them was the $20 Gold Double Eagle, a coin actively used in international trade, which made it a perfect choice for the redesign.
Double Eagle history
The Liberty Head double eagle was struck as a pattern coin in 1849 and then for commerce from 1850 through 1907, designed by the Chief Engraver at the Mint for the United States James B. Longacre.
The making of a masterpiece
Augustus Saint-Gaudens, one of America’s greatest sculptors, was a personal friend of President Roosevelt and was receptive to the idea to redesign America’s coins. The two decided the new Double Eagle would feature a beautiful high-relief design with a high rim to protect the features.
The creation of this stunning coin that investors treasure today was not without controversy. The U.S. Mint Engraver Charles E. Barber fought back with concerns the Mint could not create the high-relief design in the quantities needed. While a coin design typically only took one year, this masterpiece took three to create.
Sadly, Saint-Gaudens passed away in 1907, after the designs were finalized for production, but before a coin was struck.
Congress intervenes
After the coins were finally struck, further controversy hit as the design lacked the words: “In God We Trust.” Congress stepped in and required those words be added to the legendary coin.
The Saint-Gaudens Double Eagle coin was minted and used primarily in international trade until 1933. The Double Eagle is just one example of pre-1933 gold coins, but is considered to be one of the most valuable coins of all time.
Gold coins melted down as the Depression hits
The U.S. government halted minting gold coins as a currency in 1933 and recalled coins from circulation.
- Many of those beautiful coins were melted down into bars that are stored in Fort Knox today.
Today’s opportunities
Every pre-1933 gold coin that you’ve ever seen managed to escape the gold coin recall in 1933.
- Because of the low survival rates, pre-1933 gold and silver coins are the most desirable area of the rare coin market.
Beyond bullion: adding pre-1933 gold to your portfolio
The most successful gold investors assemble a diversified and balanced portfolio, including multiple investments including gold bullion and rare numismatics.
- The combination of history, low mintages/survival rates and price appreciation increase the long-term profit potential for pre-1933 gold coins. The fact that many coins of those term were melted set this area of the market up for outsized gains during times of gold price appreciation.
- The $20 Saint Gaudens Liberty Double Eagles are rare in that they mimic the movements of gold bullion. When gold is up, so are $20 Liberty Eagles. Once gold starts a significant run, these coins tend to simultaneously outperform gold prices.
Work with experts you can trust
Not all pre-1933 gold coins are of the same quality. As with all coins, there are significant variations in strike, luster, number and severity of contact marks, and other factors which need to be considered.
Go for the best quality and best dates you can afford. Consult with a numismatic expert at Blanchard today if you are unsure about the best opportunities to meet your financial goals.
Our meticulous coin acquisition is unrivaled, and it reflects the union of our superior business principles and impeccable rare coin selection methods. Call Blanchard today at 1-800-880-4653.
The Next 30 Years in 3 Minutes
Posted on — Leave a commentRecently the World Gold Council released a long, in-depth report offering a dimensional view of gold’s future of the next 30 years. Industry analysts, experts, and engineers gave their perspective on how our changing world will influence the value, use and availability of gold. Here, we distill their findings to the three most critical takeaways so you can get the next 30 years in just 3 minutes.

How Investment Markets Will Drive Gold Valuations
Rick Lacaille, Executive Vice President and Global Chief Investment Officer at State Street Global Advisors suggests that continued demand for gold in countries like India and China will bode well for the asset. Cultural norms in both countries underpin a belief that gold is a safer, more durable store of value than other products like securities. With so many more people seeking to become gold owners it’s likely that gold-backed products like ETFs, notes, and certificates will grow which in turn should boost gold’s value. For this dynamic to playout, however, citizens will need to gain confidence in financial markets. This confidence can only develop with a strong, stable political environment. If this scenario unfolds it may also reduce the volatility seen in gold and silver over the last three decades.
How Mining Will Influence Availability
Mark Fellows, Head of Mine Supply at Metals Focus explains that while gold production has doubled in the last 30 years, that trend will almost certainly not continue. The basis for this assertion: gold production in recent years has become more dispersed. Historically, production was highly concentrated among the big four,” South Africa, the US, Australia and Canada. Now, the big four represent less than 30% of global production as compared to 60% in the late 1980s. These mines will need to work hard to capture their share of the remaining 55,000 tons of in-ground reserves. At today’s rates that amount represents just 15 more years of production. Fellows, however, also points out that approximately 110,000 tons of gold reside in mineral deposits. Getting to this gold will prove difficult. Currently the labor involved in sourcing this gold makes the prospect too expensive. This picture could change if gold prices ascend high enough in price for the economics to work.
Technology’s Role in the Gold Market
Dr Trevor Keel, a consultant for the World Gold Council shares research from Brookings which shows that the middle-class population is poised for explosive growth. Asia will be the hub of much of this expansion. This emergence will ignite spending on technology which relies on gold for bonding wires and connector plates. This trend has implications not only for consumer technologies like computers and smart phones, it also involves healthcare technology which depends on the metal. He cites research from WHO showing that as recently as 2016 more than 300 million gold-containing tests were employed to diagnose malaria in Africa and Asia. Finally, Keel explains how demand for gold will likely grow as clean technologies, namely solar panels, will become more commonplace. Keel explains, “Recent research has even suggested that many major countries could be completely fossil fuel-free by 2050.”
Why Oil Drives Gold Prices
Posted on — Leave a commentUnderstanding the correlation between oil and gold means understanding dollar-denominated assets. Any asset priced in US dollars is a dollar-denominated asset. Both oil and gold are dollar-denominated assets. Therefore, when the value of the US dollar rises, dollar-denominated assets often drop in price. Because both assets share this characteristic, the general ebb and flow of price fluctuations of gold and oil often occur in lockstep. This connection, however, is only part of the picture.

As oil prices rise inflation also rises. Inflation is a scenario in which too much money chasing too few goods. Rising inflation means demand is outpacing supply thereby boosting prices. Oil causes this scenario to unfold because oil is a major economic driver. That is, the economy runs on oil in a literal way. Many products and services require oil. Therefore, as the price of production and transportation increases so to will the end prices of those goods and services. These mechanisms connect to gold because gold tends to increase in value as inflation increases. The result: “there is a clear co-movement between the prices of the two strategic commodities, both in nominal and real terms,” according to research. In fact, even shocks to oil prices can reverberate throughout the gold market. The same research continues, “he signs of instantaneous impact of oil price shocks on gold returns are all identically positive.”
While the data proves the correlation the connection between the two assets makes intuitive sense. In other words, rising oil prices often impede economic growth. Operations become more expensive and profitability drops. As the economy slows other investments, namely equities, tend to also exhibit slow growth. As a result, more investors shift their money into “safe haven” assets like gold.
Perhaps the clearest link between gold and oil is seen in mining operations. Mining for gold is extremely resource-intensive. Industrial machinery, all of which runs on oil, becomes more expensive to use as oil prices rise. In such a scenario, many mines may go off-line or shutdown entirely. Even exploration requires substantial oil resources. We see this relationship playout with other mined resources. Barron’s explains “the correlation between the daily iron ore price and oil price has been 72%.”
Interestingly, with so much of the economy tied to oil, it’s not surprising to learn that “oil is one of the main factors in causing variations in stock prices, exchange rate and gold prices” according to one academic publication. Countries experiencing the strongest economic growth are often the largest drives of immediate surges in oil demand. As a result, it can be argued that, in the short-term, emerging economies can have an outsized influence on near-term gold prices.
These links illustrate the increasingly global nature of investing. Portfolio diversification is becoming more difficult as the factors driving profitability exhibit increasingly equal weight on companies across different industries and sectors. A more connected world is a more complicated world. Consider, for example that “A rise in oil price leads to an augment in inflation rate and this leads to an increase in gold prices as well.” Reaching diversification means understanding the interconnectedness of these factors and holding gold.