The Straw House Stock Market
Posted on — Leave a commentWe live in a world of ever-present data and accessible analytics. At any given time investors can delve into endless metrics to distill insights on the stock market. But what if everything we need to know about investing were encapsulated in a story we heard as children? In many ways today’s market is making this idea a reality.

We all remember the three little pigs and their houses of straw, sticks and bricks. We of course remember which of those homes fell to huffing and puffing. The problem? Today’s stock market isn’t one of bricks. It isn’t even one of sticks. We’re in a straw house and the huffing and puffing could start soon.
Traditional measures of risk have encouraged a pervasive sense of calm among investors today. Volatility measures remain low. Meanwhile, the VIX index, commonly called the “Fear Index” remains at a near all-time low signaling a cavalier attitude towards investing. The problem, however, stems from the cause of these metrics. The soaring stock market performance of late appears less rooted in sound company fundamentals promising steady growth. Instead, the market is growing amid massive inflows to passive strategies.
Researchers have published findings forecasting that by the start of 2018 “passive investments, such as index and exchange traded funds, are expected to make up more than half of equity assets managed in the US.” Investors have long touted low costs and the difficulty of beating the market as reasons for adopting a passive approach. While these arguments have merit, they ignore a growing problem.
As more money flows to passive strategies the same group of companies found within S&P 500 and other index funds grows irrespective of the fundamentals. This trend “guarantees that the most valuable company stays the most valuable and gets more valuable and keeps going up. There’s no valuation or other parameters around that decision,” remarked Timothy O’Neill, the global co-head of Goldman Sachs’ investment management division. Moreover, the companies included in these funds are often the largest as measured by market capitalization which is simply the number of outstanding shares multiplied by the share price. Therefore, the single criteria for inclusion in these benchmark funds is size, not strength of management, liquidity, or value.
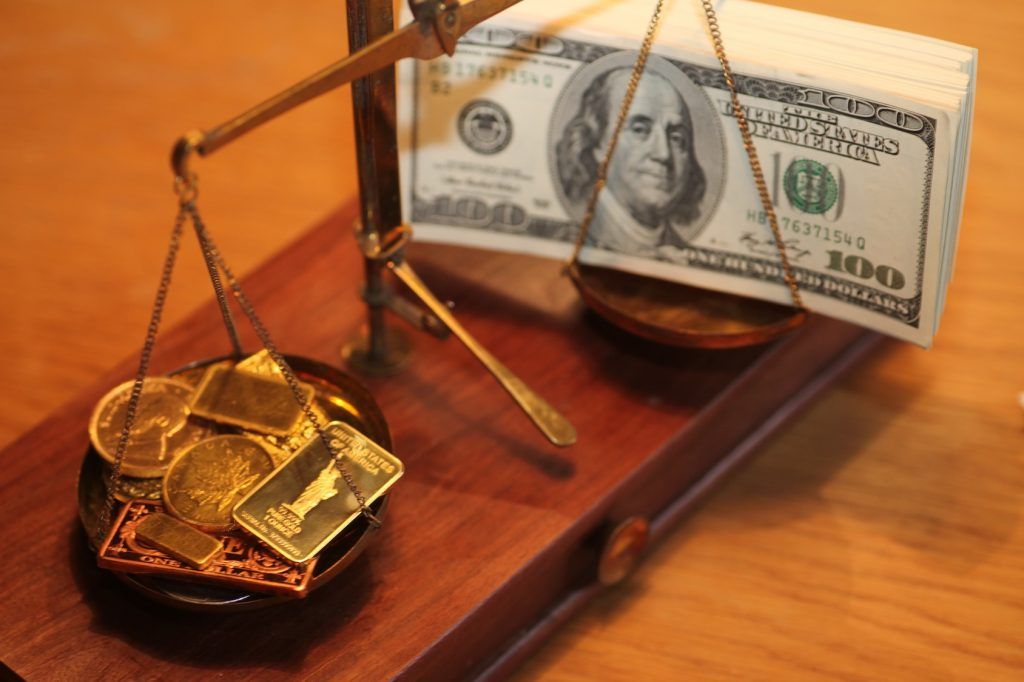
This trend is building to a market that sits atop a foundation of heightened valuations. Meanwhile, volatility can increase dramatically once the market undergoes a long overdue correction. This is where gold enters the picture.
As we’ve discussed previously on this site, gold has proven to be a remarkable effective hedge in time of steep market downturns. During the tech bubble burst occurring between 2000 and 2002 the S&P 500 lost close to half its value. During the same period the CBOE Gold Index increased by 16.34%. This same phenomenon played out during the global financial crisis when, again, the S&P 500 sank by more than half. The Gold CBOE Index rose to the occasion delivering a return of 26.53%. Moreover, during a bear market, like the two referenced above, stocks often become highly correlated. This tendency means less of the risk incurred is diversifiable. Exposure to a broad array of companies won’t help. This fact is especially true of strategies that seek to balance U.S. and foreign equities. The reason: those two groups have seen their correlations with one another more than double between 1980 and 2015.
The time to reconsider gold is before you really need it, not after.
S&P Global Says No More Fed Rate Hikes This Year
Posted on — 1 CommentCould it be? Is the official fed funds interest rate stuck at the paltry 1.00-1.25% level?
According to one well-respected Wall Street firm, the answer may be yes.
Continued soft wage gains in the latest jobs report, along with subdued inflation data give the Fed a reason to hit the pause button on any more interest rates hikes this year, says S&P Global Ratings.
If you haven’t gotten a raise in a while, you aren’t alone. Wage growth has been exceedingly soft in the years following the 2008 global financial crisis. That’s not normal. In a typical economic cycle, as the economy adds jobs and the labor market becomes tighter, employers must compete for good workers and raise pay levels. We haven’t seen that trend this time around, notes the economists at S&P Global.
S&P Global now expects the Fed to announce its balance sheet reduction (a form of policy tightening in and of itself), and then stand pat on any further interest rate increases this year. That’s bullish for gold.
In the meantime, the Dow made history last week as it crossed the 22,000 mark. Andrew Karolyi, professor of asset management and finance at Cornell SC Johnson College of Business, warns of headwinds for the stock market ahead.
“Another milestone for the Dow means another chance to ask the hard questions about fundamentals that might justify it,” Cornell’s Karyoli says.
“There are serious headwinds, including fiscal policy uncertainty (tax reform, infrastructure), political stasis, turbulence in international trade and investment relationships, and many geo-political risks,” Karyoli warns.
“A 22,000 point Dow may be just the prompt investors need to book a sit-down with their financial advisors for that regular financial health checkup,” Karyoli concludes.
Here’s something else to consider. The stock market is heading into its seasonally bearish time – late August through October.
“Investors might be better off adopting a dose of caution to their optimism during this traditionally challenging period of the year by reminding themselves not to go too far out on the risk curve,” says Sam Stovall, chief investment strategist at CFRA.
Is Your Portfolio Properly Protected?
You may be more concerned with vacations this time of year, than your portfolio. However, we urge you to take the time to analyze your allocations and if needed buy some additional protection.
Gold typically rises and often dramatically during stock market corrections. Current levels in gold offer a great buying opportunity. Take the time now to beef up your portfolio protection, with a greater allocation to physical gold and silver. Rare coins offer the opportunity for even greater price appreciation.
Read more:
Learn more about the right time to buy “insurance” here.
Reversal of Fortune
Posted on — Leave a commentAmid the fervor of a surging stock market there remains a less discussed data point lurking. The U.S. dollar has dropped 9% year to date against an index of other currencies. Some have attributed this slide to an early April comment from President Trump who lamented that “our dollar is getting too strong.” Eventually, he concluded, “that will hurt ultimately.” Meanwhile, it’s also likely that the gradual interest rate hikes we’ve seen have contributed to the decline.
Interestingly, some have posited that this definitive fall in value portends a brighter future for gold. In examining this phenomenon, one can turn to a 10-year comparison chart of The London Bullion Market (LBMA) fix gold price in relation to the daily closing price for the broad trade-weighted U.S. dollar index. The long-term picture reveals a clear inverse relationship.
For example, in mid-May of 2008 the dollar had sunk to one of its lowest points in recent history. At the same time gold was on a strong ascent choosing to rise as the dollar fell. Less than one year later the dollar began to make a sharp recovery while gold descended. Through the entirety of the 10-year span the relationship follows this “X” pattern where a rise in one asset begets a fall in another.
It’s important to note that this relationship, like nearly all in finance, is not a law of physics. There are periods when the two move in the same direction. In fact, Citi Research has gone as far as to state, unequivocally that “Commodity prices have traded in a strong inverse relationship with the U.S. dollar over the past decade or so, but this relationship broke down in late 2016 and the breakdown looks here to stay.”
Some may argue that data from just 2016 onward is insufficient to reach a conclusion that contradicts a decade of patterns. The main underpinning to their argument is that a reduction in volatility in the commodities market as well as a broad recovery from the global financial crisis has brought the negative relationship to an end.
Today we’re witnessing the dollar close at values nearing a 13-month low and investors are beginning to turn their attention, once again, to gold. Those asking how this trend will play out are looking to political headlines for clues. Economic policies designed to spur growth have not yet materialized amid a new administration. “”There seems to be very little progress being made on a number of ‘pro-growth’ Trump initiatives, all being net bullish for gold,” remarked an analyst with INTL FCStone.
In the meantime, investors are leaning on comments from the Fed for clues on gold’s direction. While additional rate increases are certainly possible it’s also likely that such expectations have already been priced into the market. Some analysts have remarked to The Financial Times that they hold a near-term target at $1,300 per ounce after weighing all the conditions.
Today, the correlation between commodities like gold and the dollar continue to evolve. However, for the long-term investor this holds little sway. The gradual, but significant rise in gold over an extended period always offers value.
The Dow Jones Just Made History
Posted on — Leave a commentStocks finished the first week of August mostly higher as strong earnings reports and upbeat economic data kept lingering bullish sentiment alive. The Nasdaq 100 index did not perform as well as its two other benchmark index peers, the S&P 500 and the Dow Jones Industrial Average.
For the week, Nasdaq 100 futures posted a small decline of 0.35% while S&P 500 futures had minimal gains of 0.05%. The Dow Jones stole the spotlight as it made its 8th all-time record high on Friday and closed out the week with impressive gains of 1.07%.
Although much of the week’s gains came from robust earnings reports, a stronger-than-expected July jobs report released by the Bureau of Labor Statistics provided a moderate boost to stocks on Friday. Analysts on Wall Street were forecasting an increase of 175,000 jobs for the month of July. The report blew those expectations away as it stated employers added 209,000 new jobs.
Moreover, the unemployment rate touched a fresh 16-year low of 4.3%. Both of these metrics are seen as indicators that the labor market is healthy and improving.
However, it’s not only market analysts who are obsessed with jobs reports. The Federal Reserve closely monitors every jobs report to gauge whether the economy can tolerate interest rate alteration.
One of the key events that will affect the prices of stocks and everyone’s favorite precious metal, gold, will undoubtedly come later this year when the Federal Reserve announces their much-anticipated interest rate decision.
Many market participants are expecting one more rate hike before the end of the year. However, with the exception of July’s jobs report, much of the economic data recently released has been relatively weak. This is leading some folks to speculate that the Federal Reserve may not increase their benchmark lending rate after all.
Referring to the jobs report data, Jeff Zipper, the managing director of investments at U.S. Bank Private Client Wealth Management, noted how “the number came in above consensus, but in the ballpark we were expecting, so we’re taking it in stride. There were no big surprises, and net-net, I think the Federal Reserve remains on track for one more interest rate hike this year after this.”
As a general rule, rising interest rates are somewhat detrimental to stocks and commodities because the increased cost of borrowing. When the cost of borrowing rises, investors like to purchase yield-bearing assets like Treasury bills, bonds, and other forms of fixed-income investments.
Despite the strong jobs numbers buoying markets, individual stocks played a major role in last week’s gains as well.
Apple Inc., the largest company in the world by market capitalization, posted outstanding Q3 earnings as it topped iPhone sales estimates and quashed any fears that smartphone market is slowing.
Apple’s stock, which trades under the symbol AAPL, soared more than 6% to make an all-time high of $159.75 in after-hours trading.
Apple’s earnings are particularly important because it is the largest company in the world by market capitalization.
For the Dow Jones Industrial Average Index, which made an all-time high on Friday, Apple’s portion of the index is a significant 4.84%. Since Apple traded approximately 6% higher, strong gains in the Dow were in order. The Dow Jones made fresh all-time highs every day of last week marking eight consecutive record closes.
On the commodities front, gold fell almost $12, or -0.91%, in the wake of the strong jobs report but still remains well above $1,250 per ounce.
For now, it seems the two expected driving forces of the market are the remaining earnings reports from large-cap companies and additional economic data that might alter the Fed’s monetary agenda. However, dramatic market moves are always unexpected, and August is historically a poor month for stocks and consequentially a strong month for gold. As such, even with stellar company earnings, investors are staying on their toes, especially with the market at all-time highs.
Since 1975, Blanchard has successfully helped 450,000+ clients invest wisely in precious metals and rare coins. Our team of experts are always here to help you make the right investment decisions and capitalize on opportunities in the precious metals market.
Call us today at 800-880-4653
Gold Hits 6-Week High on Slow Growth Report
Posted on — Leave a commentInvestors piled back into the gold market last week, propelling the yellow metal to its highest level in six weeks. Increased worries about slower-than-expected economic growth helped boost precious metals prices.

Gold climbed as high as $1,271.50 an ounce, while silver hit $16.84 an ounce.
Precious metals got a boost last week after the Labor department announced slightly weaker-than-expected second quarter gross domestic product growth at 2.6%, compared to Moody’s forecast of a 3.00% growth rate. The “animal spirits” have yet to emerge to propel the economy forward to the 3% range. The slower growth could delay future Fed rate hikes, which is a gold-bullish factor.
The stalled legislative agenda in Washington D.C. also increased gold’s appeal last week after Republicans failed to repeal the Obama Care health law. The inability of the Republicans to push through health care legislation is reducing optimism that significant tax reduction or infrastructure spending will occur to stimulate economic growth.
All Eyes on Jobs Report
This Friday’s release at 8:30 am ET of the July employment report will be the next key economic report for investors. The median estimate for July non-farm payrolls is a 183,000 increase, which could add downward pressure to the overall unemployment number. “Another strong month of employment growth should have been enough to push the unemployment rate back down to 4.3% in July, and the surveys suggest it will fall even lower,” according to Capital Economics.
The labor market remains tight. For any businesses who have been trying to fill open positions, the tight labor conditions have made hiring qualified workers a challenge.
Investing Tactics
If the jobs data were to come out weaker-than-expected it would likely provide a lift to the gold market. Conversely, stronger-than-expected data would likely pressure the market.
If you are looking to add to your precious metals holdings, using any “dips” or short-term pullbacks in price is a smart way to build your position at more favorable prices. You can monitor current prices here.
Storm Brewing?
Gazing into the crystal ball, there could be a storm brewing on the horizon. With a stalled legislative process seen in Washington, what could this mean for the debt ceiling limit?
Treasury Secretary Steven Mnuchin has said that the government probably has enough available cash to meet obligations through September. The latest projections from the CBO suggest the debt ceiling limit will be hit in October.
“That means the mid-September FOMC meeting could come amidst a disruptive fight in Congress over raising the debt ceiling. Markets have already begun to price in some risk of default, with the yield on three month Treasury bills recently rising above that on six month bills,” Capital Economics said.
Noteworthy: markets are taking notice earlier this time. “Investors have started worrying about a debt ceiling stand-off much earlier than during previous crises. Back in 2012 and 2013, markets showed little sign of panic until a week or two before the debt ceiling deadline, Capital Economics said.
If a stand-off in Congress rattles markets, gold will be a key beneficiary. It was the debt ceiling crisis in 2011 that sent gold to its all-time high above $1,900 an ounce.
Current levels offer a great buying opportunity for gold. In just a few months, headlines could be reading “Gold Hits 6-Month High.” Smart investors buy low and sell high. Current levels in gold are rising, but still remain relatively low. Call Blanchard today to discuss your investment plans.
America’s Silver Workhorse
Posted on — Leave a commentToday we bring you the history of a workhorse coin. For 54 years, this small-but-mighty coin was an essential component in the engine of American commerce. Countless millions saw this design every day for over half a century, and for many, it represented a honest hour’s work. While this coin doesn’t get the attention of, say a $20 St. Gaudens, it represents a breakthrough in both design and technology.
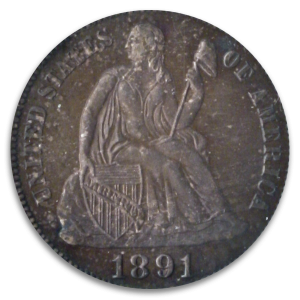
The Seated Liberty Dime was minted 1837-1891, starting at the end of Andrew Jackson’s presidency. Jackson’s presidency inaugurated what would come to be known as the “Jacksonian era” in American politics. The era saw an expansion of suffrage to non-landowning white men, and increased public participation in government—seen, for example, in the election (rather than appointment) of judges.
At the same time, the country was rapidly expanding through war and settlement. Many Americans believed in Manifest Destiny, the idea that America was destined to stretch from Pacific to Atlantic, with settlers paving the way. The idea of the wild, dangerous frontier and its place in the American character grew in prominence.
The era, in other words, was one of expansion, populism, and national myth-making.
A Bold New Design for American Coinage
In the midst of all this, in 1837, America became ready for a new, bolder coinage. Mint Director Robert Maskell Patterson requested an image of the goddess Liberty inspired by the Britannia of English coinage. The resulting design was immediately praised for its artistic qualities and symbolism.
Liberty, in a flowing dress, sits on a rock while holding a Liberty pole in her left hand. The Liberty pole originated in ancient Rome as a symbol of the people’s freedom from Caesar’s tyrannical rule, and liberty poles were frequently erected in colonial town squares before and during the American Revolution. Liberty’s right hand rests on a Union shield inscribed with the word LIBERTY. The reverse features the words ONE DIME surrounded by a wreath of not just the traditional laurel leaves, but the American symbols of corn, wheat, and maple leaves as well.
While the design represented a shift in American coinage, so too did the coin’s manufacture. The Mint had long aimed to create coins resistant to counterfeit, and made a major leap forward with the Seated Liberty coinage. The reverse was manufactured 100% by machine—without any elements needing to be added by hand. By increasing uniformity among coins, this technological breakthrough discouraged counterfeiting.
For all its positives, the Seated Liberty Dime did run into some trouble in the court of public opinion. Namely, why didn’t it have the usual 13 stars for the first 13 colonies? One year later, stars were duly added, and the rest of the design was adjusted to make room for them. Quite a few other major and minor design changes were made over the coin’s 50-year history, creating numerous opportunities for collectors. One particularly unusual variant is the 1859 transitional design, which lacks reference to the coin’s issuing nation!
Reversal of Fortune
Posted on — Leave a commentAmid the fervor of a surging stock market there remains a less discussed data point lurking. The U.S. dollar has dropped 9% year to date against an index of other currencies. Some have attributed this slide to an early April comment from President Trump who lamented that “our dollar is getting too strong.” Eventually, he concluded, “that will hurt ultimately.” Meanwhile, it’s also likely that the gradual interest rate hikes we’ve seen have contributed to the decline.
Interestingly, some have posited that this definitive fall in value portends a brighter future for gold. In examining this phenomenon, one can turn to a 10-year comparison chart of The London Bullion Market (LBMA) fix gold price in relation to the daily closing price for the broad trade-weighted U.S. dollar index. The long-term picture reveals a clear inverse relationship.
For example, in mid-May of 2008 the dollar had sunk to one of its lowest points in recent history. At the same time gold was on a strong ascent choosing to rise as the dollar fell. Less than one year later the dollar began to make a sharp recovery while gold descended. Through the entirety of the 10-year span the relationship follows this “X” pattern where a rise in one asset begets a fall in another.
It’s important to note that this relationship, like nearly all in finance, is not a law of physics. There are periods when the two move in the same direction. In fact, Citi Research has gone as far as to state, unequivocally that “Commodity prices have traded in a strong inverse relationship with the U.S. dollar over the past decade or so, but this relationship broke down in late 2016 and the breakdown looks here to stay.”
Some may argue that data from just 2016 onward is insufficient to reach a conclusion that contradicts a decade of patterns. The main underpinning to their argument is that a reduction in volatility in the commodities market as well as a broad recovery from the global financial crisis has brought the negative relationship to an end.
Today we’re witnessing the dollar close at values nearing a 13-month low and investors are beginning to turn their attention, once again, to gold. Those asking how this trend will play out are looking to political headlines for clues. Economic policies designed to spur growth have not yet materialized amid a new administration. “There seems to be very little progress being made on a number of ‘pro-growth’ Trump initiatives, all being net bullish for gold,” remarked an analyst with INTL FCStone.
In the meantime, investors are leaning on comments from the Fed for clues on gold’s direction. While additional rate increases are certainly possible it’s also likely that such expectations have already been priced into the market. Some analysts have remarked to The Financial Times that they hold a near-term target at $1,300 per ounce after weighing all the conditions.
Today, the correlation between commodities like gold and the dollar continue to evolve. However, for the long-term investor this holds little sway. The gradual, but significant rise in gold over an extended period always offers value.
The Stock Market is Going Wild
Posted on — Leave a commentLast week was another wild week for stocks in the United States. All three benchmark stock indices soared to new levels as each index set a new all-time high on Thursday.

Emini S&P 500 futures made a new high of 2480.50, while Nasdaq 100 futures printed at $5995.75, stopping just short of the key psychological level of $5,600. Emini Dow Jones Industrial Average futures set an all-time high on Thursday of $21,475, and then went on to break that record on Friday by climbing to $21,753.
It seems all-time market highs have become the new norm of 2017. However, as the old expression goes, “what goes up must come down.” That maxim rang true for stocks on Thursday afternoon.
The Nasdaq 100 led a very swift decline almost immediately after making its all-time high. Prices plunged over 1.5% in a matter of an hour before rebounding slightly to close out the day.
The tech-fueled decline caused additional weakness for the entire stock market. For market participants that have been keeping abreast of the markets, a pattern certainly seems to be emerging.
Markets make new record highs, technology stocks instigate declines, markets recover, and then the entire process repeats. For the most part, this is how markets have been functioning this year. Despite all of the abrupt sell-offs, the S&P 500 is up 1.8% since the start of the month and 10% since the start of the year.
Nevertheless, the startling declines immediately after all-time highs have been keeping investors on their toes. Some analysts on Wall Street are chalking up the dichotomy of all-time highs and startling sell-offs to seasonality.
“It is not surprising for market participants to take profits after a big rally, especially going into August, which is historically a difficult month,” said Quincy Krosby, chief market strategist at Prudential Financial.
On August 24th of 2015, when China shocked the world by devaluing its currency, global markets suffered declines of more than 10% in one day. The Emini S&P, Dow, and Nasdaq futures were all halted by the Chicago Mercantile Exchange in an effort to put an end to the epic plunge. The VIX Index, also known as the fear gauge, briefly jumped as much as 90% to print above 50.00 due to sheer fear and uncertainty.
Although the past is no indication of the future, there definitely seems to be some merit to the idea of stock market vulnerability in the month of August.
Having said that, for the last trading week of July, gold is made its third consecutive weekly gain. Although prices seemed to be buoyed by reports of missile tests in North Korea last week, declines in the US dollar certainly added to the cause. A GDP report, which was released on Friday, was expected to help the weakening dollar and hurt gold, but analysts found few reasons in the report for the Federal Reserve to alter is cautious and slow rate-hike agenda.
Going into the month of August with a somewhat-dovish Fed and historical market abnormalities as an ominous precedent, all signs seem to support the fundamental thesis to own a piece of the yellow metal.
Since 1975, Blanchard has successfully helped 450,000+ clients invest prudently in precious metals and rare coins. Our team of experts are always here to help you make the right investment decisions and capitalize on opportunities in the precious metals market.
Call us today at 800-880-4653
Red Dogs, Smooth Monkeys, and Stump Tails
Posted on — Leave a commentImagine if the U.S. were to witness its paper currency plummet to just 4% of its face value. Then, imagine the ruling powers were to decisively withdrawal all government deposits from its central banks. Finally, imagine we start to produce 45% of the world’s gold supply. Now, imagine that all those things have already happened. Welcome to the turbulent early days of gold.

Divisiveness and debate were at home in America during the nineteenth century as much as they are today. Only in that time one of the major topics was determining how to handle the issue of money. That is, the founding fathers had to determine how currency would work in this burgeoning land.
Many people detested paper money and considered gold, as many do today, as the only real, dependable form of payment. However, the U.S. was taking shape and if economic growth were to be sustained how would gold scale? Citizens would have to mine it and track it and all at a speed that kept pace with the rapid population growth occurring across the land.
Therefore, states issued their own paper currency. These predecessors to the money we use today carried names like “red dogs,” “smooth monkeys,” and “stump tails,” as researcher and historian James Ledbetter explains in his latest book. However, despite the necessity of this system leaders like Thomas Jefferson warned that “bank notes will be as oak leaves.” He, like others feared rampant inflation.
Meanwhile, a uniform paper currency still eluded the country. In isolated cases Jefferson’s fears came to fruition as Rhode Island banknotes sank to just 4% of their face value from 1730 to 1750. This outcome was not uncommon. Ledbetter offers an anecdote from a man who saw a one-dollar note diminish to nothing in the span of traveling just one hundred yards. The reason: across state lines various currencies held different sway.
However, the gold rush sparked renewed fervor around precious metals as production peaked in approximately 1852. The onslaught of ordinary miners seeking wealth came fast. But deposits were soon depleted and any remaining gold required heavy, expensive machinery to be unearthed.
Today, gold remains as captivating to Americans and investors across the world. As of the end of the first quarter of this year bar and coin demand increased by 9% YoY. Interestingly, this growth is due, in part, to a resurgence in interest among banks which are “increasingly looking to develop their gold businesses to offer a compelling proposition to investors,” according to The World Gold Council.
Moreover, this trend has international appeal. In the last quarter of 2016 the Bank of China started offering investors an interest-bearing gold instrument. Other inventions like “Microgold” offer investors a physical-backed product which makes purchasing the precious metal easier. This development represents a drive to bring a new generation into the world of gold investing through more accessible digital means.
Gold was never abundant enough to support the breakneck speed of America’s development. However, this very fact forms the basis of its appeal today; its rarity underpins its effectiveness as a universal, global currency. “Stump tails” change but gold is here to stay.
What happens when a country abandons 86% of their circulated currency?
Posted on — Leave a commentIn early November of 2016 the Indian government declared that they would no longer accept 1,000 and 500 denomination notes. The move was intended to counteract the “shadow economy” while slowing the efforts of counterfeiters. Citizens were instructed to return all paper currency of these values to their local bank. Estimates put this total at 15.44 trillion equaling 86% of the county’s currency sending shock waves through their economic system.
The first major indicator of trouble following the government’s decision was a plummet in the Purchasing Managers Index, or PMI. The figure dropped to its lowest level on record. This free fall indicated that the health of the manufacturing sector was failing. The factors considered in the PMI calculation include new orders, inventory levels, production, supplier deliveries and employment. Motorcycle sales also dropped. While this may sound inconsequential the trend represents “a good measure of the health of India’s cash reliant rural economy,” according to Allistair Hewitt, Director of Market Intelligence at The World Gold Council. Those sales fell to their lowest level in six years.
In recent months, however, the economy in India has improved. Both the PMI and motorcycle sales have inched closer to previous levels giving citizens reason to foster guarded optimism. Despite this gradual recovery though, the demonetization efforts have destabilized the faith many citizens once had in fiat currencies. This truth is evidenced by research from The World Gold Council conducted in the first quarter of 2016. The study found that a substantial 63% of Indian residents agreed with the statement, “I trust gold more than the currencies of countries.” Moreover, nearly three quarters of the respondents agreed with the statement, “Gold makes me feel secure for the long-term.”
Buying behavior in the weeks preceding and following the demonetization efforts support these findings. ‘People frantically bought gold bars and jewelry till late midnight,” remarked one jeweler in the country according to The Hindu. The renewed fervor surrounding gold may have global implications. Reports from Business Insider indicate that India and China together make up 50% of global consumption.
India’s economy amid this upheaval serves as an example of how gold is inherently different from paper currency. When people become skeptical of a country’s economic health they turn to the only currency that’s accepted worldwide. The precious metal is not supported by faith in an economy or government. Rather, scarcity and global demand underpin the value of gold.
This reinvigorated interest in gold underscores the difference between things with intrinsic value and those without it. Fiat money (paper money) carries the risk of devaluation, or even becoming worthless, in the event of hyperinflation. By its nature fiat money is unlimited, the government can always print more. This leaves it susceptible to bubbles. Meanwhile, gold, with its limited supply, offers investors an alternative.
“Fiat” is Latin for “it shall be.” However, in darker periods of history people have learned that “shall” never came.