Investor Fear Just Reached a 23-Year Low Last Week
Posted on — Leave a commentDuring trading on Tuesday of last week, the CBOE VIX index fell to 9.56, a level not seen since 1993. Although the VIX climbed above 10 later in the week, everyone on Wall Street was buzzing about the record breaking level of low volatility. But what does this mean for the typical investor?

Well, the price/level of the VIX is derived from the pricing of near-term options on the S&P 500 index. A low VIX level equates to cheap options premium, and thus, narrow trading ranges and an absence of fear in the market. Many analysts were baffled that volatility and investor fear could be so low amid foreign presidential elections, unprecedented domestic political change, and reoccurring nuclear threats from North Korea. Despite all of these potential threats, and more, the VIX sank to a multi-decade low.
However, the VIX was not the only index that set a record last week. On Monday, the S&P 500 index hit a fresh all-time high of 2,401.36. The new all-time high was mostly driven by upbeat earnings announcements. Despite briefly rallying on Monday, disappointing earnings from a few of the main retail clothing stores weighed on the market in the final trading days of the week.
Nonetheless, given that stocks are staying near their highest levels in history, a low amount of fear in the market seems reasonable.
“Overall the economy is still growing, unemployment is still extremely low, inflation is very much in check and the US Federal Reserve is raising rates but at a very low pace. I think all that is positive for risky assets.” said Mandy Xu, derivatives strategist at Credit Suisse.
Essentially, a stock market that just keeps climbing, like we have now, seems to be the perfect recipe for a very low VIX. But if the past offers any indication of the future, it might not be entirely smooth sailing ahead. There is a noticeable correlation between low VIX levels and sudden market sell-offs.
When the VIX dropped below 11 for the first time in years on August 6th, 2015, preciesly18 days later on August 24th there was one of the worst intraday market crashes in history. The S&P 500 cratered as much as 10%, the VIX subsequently soared above 50, and spot gold climbed double digits.
The logic behind quickly transitioning from a low volatility environment to a high volatility environment is primarily attributed to the fact that investors are not pricing in any wild price fluctuations. Because of this, investors can rapidly and easily be caught off guard when the market turns against them and positions are not hedged due to low fear sentiment, i.e. a low VIX.
Only time will tell if the historic low in the VIX made last week will precipitate imminent stock market turmoil. One thing is for certain, however, if a little market chaos is indeed lurking around the corner, those who stand to benefit the most are gold owners.
Diving Below The Surface of a Complacent Market
Posted on — Leave a commentToday, the stock market resembles the calm surface of a quiet ocean. The CBOE VIX Index (the “Fear Gauge”) recently reached a 23-year low. This standard measure of anticipated volatility in the equities market reflects a broad sentiment of complacency among investors. The market doesn’t expect a significant upswing or downturn anytime soon.
More than ever, the market seems is willing to shrug off major events. “Brexit” has exerted little impact. Trump’s election has only helped stocks, and even the recent news of Comey’s firing has done little to destabilize investor confidence. However, below the surface, there is reason to question the future of equities even for passive investors.
Too many investors see calm markets without considering one important number, the Shiller P/E ratio. In short, this single number measures valuation among the stock market. The calculation divides a stock’s price by its earnings while adjusting for inflation.
A high Shiller P/E indicates stocks are highly valued and expensive. A lower figure means stocks are cheap. Today, the Shiller P/E is 29.7. Why is this finding significant? At 29.7 the Shiller P/E is 76% higher than the historical mean of 16.8.
Moreover, this figure sometimes called the cyclically adjusted price-earnings ratio (CAPE), is the highest on record except for 1929 (market crash) and 2000 (dot com bubble bursting). Over the decades, a clear pattern has emerged. Heightened Shiller P/E ratios tend to occur shortly before a significant market downturn or “correction.”
The problem with a high figure like this is that it reflects the astronomical expectations of investors. At such high valuations and expensive prices, stocks will need to deliver outsized returns to justify their share prices. What if they fail? If these companies are unable to deliver, the market will fall.
Does this mean investors should expect a crash? The answer is no. However, these numbers should instill a sense of vigilance. Volatility might be low amid a soaring equities market, but valuations are equally high. This dichotomy sets the stage for disappointment. Meanwhile, increasing uncertainty surrounding the U.S. political landscape is building. Shiller, the man behind the formula, remarked in Q1 of this year that it’s “high enough to worry about.”
Shiller continued by suggesting “reducing your holdings of stocks, especially for a long-term investor. We can’t time the market accurately, but we know that when it’s this high, over the long term, it usually doesn’t do great.” These comments come from a man who won the 2013 Nobel Prize in Economics.
Equity investors take note. Today’s market might be sending signals that diversification is more important than ever. No one can forecast a crash or proclaim that one is imminent. However, a smart read of the market gives investors reason to reconsider their asset classes. Being too heavy in stocks without an exposure to uncorrelated assets like gold is dangerous because it leaves risk unbalanced.
Investors can take this early opportunity to reevaluate their portfolio to ensure they’re safeguarded in the event we see a market resembling 1929 or 2000.
$20 Billion in Gold ETFs Doesn’t Buy What It Used To
Posted on — Leave a commentSome are questioning if active investment strategies are dying. “Investors have pulled $304.7 billion from active U.S. funds in the past 15 months,” reports The Wall Street Journal. Investors have awoken to the higher costs of active funds and tepid performance which often fails to outperform or even match the broad market. Meanwhile, passive investment products are soaring amid a gain of $735.5 billion over the same period.

The frenzy is reaching the gold mining ETF market. “In the past six months, waves of money rushed into a $20 billion complex of interlinked exchange-traded funds that invest in gold mining companies,” explains The Wall Street Journal. Some of these ETFs have taken in $1.4 billion since September. Inflows of this size are starting to change the markets. When this much capital rushes into an ETF within a short period, the funds must purchase more shares. These movements can create problems.
For example, a gold ETF may close its doors to new investors. The reason: fast ascending share prices exceed the value of the underlying assets. Managers and investors are learning that widespread devotion to a passive approach has its problems. In previous articles, we’ve explored why gold ETFs fall short of the benefits offered by holding the physical product. However, here we see a new reason in the form of unwarranted prices. Moreover, these surging share prices appear to stem from investor excitement over passivity rather than the inherent value of the assets.
These recent events illustrate how gold ETFs can create unintended consequences. As a result, some analysts warn that markets will become less efficient. In extreme examples, a publicly traded company might discover that their largest shareholders are a few large institutional investors. These monoliths capture more shares as their index funds pull more passive investors into the fray.
This problem is systemic. As a public company’s market share increases, an index fund would need to follow suit. That is, the fund would need to buy more shares to become more representative of the market. This cycle means the company’s share price continues to ascend due purely to reactive moves from an index fund rather than profitability or sound management decisions. “Some studies suggest stocks included in popular indexes sport higher valuations and tend to move in lockstep with one another instead of responding to fundamentals,” explains The Wall Street Journal.
Ownership of physical gold presents an elegant solution to this problem because it’s free from the fluctuations arising from capricious ETF inflows. Commodities like precious metals are comfortably outside the whirlwind of tumultuous investor psychology. True gold investors seek the metal because of its rarity and not the complexity of leveraging and derivatives common to ETF shares.
The problem is getting worse as momentum towards passive investing grows. “Nearly one in every $5 invested in stock funds is invested in an index fund, up from less than one in every $10 in the year 2000,” explains one journalist at CNBC.
It’s ironic that investors identifying themselves as passive are unwittingly exerting powerful force upon the market.
Is Your Uber Driver Giving You Stock Tips?
Posted on — Leave a commentOptimism, excitement and euphoria. Those are typical emotions seen at market tops. Wall Street insiders know that the “public” or regular Mom and Pop investor are usually the last ones to join into a stock rally.

The joke goes when your hair dresser or your taxi driver are giving you stock tips, you know the current rally has reached its exhilaration phase.
Wall Street took heart in the passage of the Health Care Reform bill in the House last week. That is the first step toward enactment of a “repeal and replace” plan for Obamacare. The stock market remains in an ebullient mood as the major indices climb to new record highs.
Can Congress Deliver For the Economy?
The health reform bill’s passage in the House was viewed as the canary in the coal mine and viewed as a positive indication that Congress can indeed deliver on President Trump’s legislative agenda.
It is easy to get caught up in the euphoria of higher stock prices, but investors who are pouring fresh money into equities right now are late to the party.
- Last week’s House health care bill passed by a narrow margin of 217-213. Notably, 20 Republicans crossed the aisle to vote against the bill.
- The next step involves the Senate and it is generally agreed the health care reform bill cannot pass in its current form there.
“The timeline for the bill remains highly uncertain, but it is likely that the process in the Senate will take longer to resolve compared to that in the House and may possibly take several months,” says Mark Doms, Senior Economist at Nomura. “This timeline could adversely affect Republican tax reform efforts in Congress,” Doms adds.
What Does This Mean For Markets?
If the Republican controlled Congress is unable to pass a repeal and replace law for health care, it calls into question what type of tax reform will be enacted.
Many on Wall Street expect a significantly watered down version of the current tax proposals to be enacted. That means less lift to the economy overall.
“We hold to our earlier expectation of a modest tax cut, instead of full-scale tax reform, as the most likely result. A modest tax cut would require much less time on the legislative calendar compared to comprehensive tax reform,” Doms says.
The stock market rally is being fueled by hope, euphoria and Pollyanna optimism that major reform will be enacted. Investors with long memories will remember how the Dot.com crash quickly unraveled in 2000.
How You Can Protect Your Assets
Gold has historically zero correlation to the S&P 500 (0.02) it has provided a proven diversification benefit to investors who have a large part of their retirement assets in stocks.
The current cycle in stocks will turn. It always does. Bull markets don’t last forever. Don’t get caught up with the crowd. No, your Uber driver doesn’t know more about the stock market than the Wall Street experts. Take the time to prepare your portfolio now.
Markets Advance for Third Straight Week
Posted on — Leave a commentIt was another solid week for US stocks with a host of positive earnings reports and upbeat economic data giving a nice boost to prices. Eight out of the ten sectors in the S&P 500 were positive on Friday; the health-care and financial sectors lagging behind.
The reason stocks are not entirely green across the board, particularly in the health-care sector, is thought to be associated with Thursday’s passage in the House of a revamped health-care reform bill. There is still a sizeable amount of lingering political uncertainty as a result of the bill’s initial success. Next up is the Senate, where passing the bill might prove to be more of a challenge.
Regardless of future policy change, company earnings are robust, and this is probably the single biggest driver of the market. Analysts anticipated a 9.1% rise in corporate earnings for 2017 from the year prior, and with over 400 companies reporting, earnings are currently on track to rise 13% YOY, according to Factset.
Technology companies in the S&P 500 and the Nasdaq 100 have seen the most growth since last year. Currently, the S&P 500 technology sector is up about 17% from a year ago, which is quite impressive.
In response to the strong tech sector, Ketu Desai from i-squared Wealth Management said, “in an economy with 2% or 2.5% growth, these companies are growing at double digits. They’re going to be the engines of growth for the economy.”
But they are not the only sources of growth for the market. April’s jobs report released on Friday from the US Bureau of Labor Statistics showed a sharp increase from last month with 211,000 new jobs created in April. Economists were expecting the number of new jobs to be around 185,000. Unemployment levels also defied expectations as they sunk to a fresh new low of 4.4%, not seen since before the financial crisis in 2007.
“It calms the folks that thought we were headed toward a labor market slowdown,” said Sameer Samana, global quantitative and technical strategist at Wells Fargo Investment Institute.
Strong jobs reports often lead the Fed to tighten monetary policy, because the overall economy is growing and seems healthy enough to withstand rising interest rates. When this happens, non-interest-bearing assets like gold and stocks can often lose their appeal.
Gold has had a rocky start to the month. Gold fell through support at $1,250, but is still well above the key level of $1,200. The long-term case to own gold seems to still be intact.
For other commodities, crude oil rebounded from a new of 2017 that was formed on Friday. Concerns about oversupply and the lack of demand have been unequivocally plaguing the oil market. When oil has large negative price movements and spills over into the stock market, it usually adds downward pressure for stocks, but since crude rebounded it actually aided the energy sector and stocks in general on Friday.
Steady Fed Leaves Balance Sheet Questions Unanswered
Posted on — Leave a commentThe Federal Reserve held short-term interest rates steady, as expected, at the conclusion of its two-day meeting on Wednesday.
The central bank also indicated that it regarded recent economic weakness temporary and that won’t impact its plans to gradually increase interest rates later this year. Recent data revealed that the U.S. economy grew by an extremely tepid 0.7% rate in the first quarter.
A Non-Event for the Markets
Financial markets registered a ho-hum reaction to the Fed’s statement. Spot gold traded lower ahead of the Fed announcement and failed to register a significant reaction to the news, recently trading around $1,248 an ounce. The stock market held at slightly weaker levels after the announcement.
Investors had not expected the Fed to hike rates, but were looking for clues on the timing of the next interest rate hike. The market is currently pricing in expectations of a 70% chance of a rate hike at the June meeting. Wednesday’s statement did nothing to alter those expectations.
Could Government Shutdown Derail The Fed?
Currently, the financial markets are pricing in expectations of a small interest rate hike at the Fed’s June meeting. However, some analysts note the political uncertainty in Washington D.C. could become a factor for the Fed.
“It’s up in the air as to whether the Fed will see the need to raise interest rates again in June,” says Colin Cieszynski, chief market strategist at CMC Markets. “Adding to the volatile mix, however, is comments from President Trump, who, having lost this round of budget negotiations, appears to be setting the stage for a big showdown and favoring a government shutdown in September. This pretty much rules out a September rate hike, so if the Fed doesn’t raise in June, they may not get another chance until December,” he says.
Still Far From Normal
Even if the Federal Reserve does hike interest rates once or twice in 2017 – it will still leave the federal funds rate well below its historically normal range around 3.5%. The current 0.75-1.00% level leaves liquidity levels high throughout the financial system.
This Has Never Been Done Before
The Fed’s balance sheet has swollen to a historic $4.5 trillion in the wake of the 2008 global financial crisis. There are over $400 billion of bonds maturing in the next 12 months period. How will the Fed handle this?
Fed officials have floated the idea of the bonds roll off its balance sheet as bonds mature, believing that to be a less disruptive process than selling the bonds, but have yet to reveal a specific plan to unwind the balance sheet.
What does this mean? The Fed will be removing itself as a big buyer of bonds – especially in the mortgage sector. When you remove a major buyer, that means less demand and rates will go up. There is potential for a big disruption in the bond market ahead, which could drive interest rates higher. That in turn could weigh on U.S. economic prospects, which are already showing signs of faltering.
Current Levels Are a Buy
Gold remains well below price levels seen in 2016 and is poised for continued gains throughout 2017. Demand for both gold and silver have been strong in the first four months of year, as investors are turning to metals as a safe haven. Current price points likely offer the best buying opportunities of the year in these metals.
A Fascinating Nugget of Gold Rush History
Posted on — Leave a commentBoth coinage and paper money in the pre-Civil War United States were a somewhat freewheeling affair. Americans used tens of thousands of types of money. There were federally issued coins, Spanish, French, and Brazilian coins, and paper money issued by state and local banks (anyone could start a bank and start issuing currency). And that doesn’t even take into account the notes issued by semi-legal and illegal banks.
The cornucopia of currencies led economist J.K. Galbraith to comment, “By the time of the Civil War, the American monetary system was, without rival, the most confusing in the long history of commerce and associated cupidity.”
“Territorials” were coins issued by private minters, entrepreneurs, and other enterprising types, filling a gap that the federal government wasn’t. The first territorials appeared in Georgia and North Carolina, the latter being home to the famed Bechtler coins.
After gold was discovered in California, gold dust and nuggets abounded in local communities, but a severe shortage of coinage hampered commerce. It was expensive and dangerous to transport gold back East for coining, and people instead bartered or used the unreliable “pinches” of gold dust to pay for goods and services. The U.S. Constitution prohibited states from issuing money — but not private individuals.
By late 1849, 18 companies in California were issuing territorials. Congress couldn’t agree to authorize a San Francisco mint, due to competing demands for mints in other states, but in 1850, a bill was passed authorizing an Assay Office, which was run by Augustus Humbert. The office had the authority to assay gold and validate its value.
In 1851, Humbert received some private territorials for assaying, and he found that they contained only 97–99% of their stated value. The ensuing negative publicity caused a rush of people attempting to sell of their territorials, which dealers and bankers would only accept for, at most, 80 cents on the dollar. The purchasers then resold the coins to Humbert, who melted them down and produced his own coins.
Interestingly, Humbert’s Assay Office didn’t produce denominations smaller than $10 and $20, because Congress deemed that doing so would make the Assay Office too Mint-like in its powers. In 1853, the Assay Office was closed, and the San Francisco Mint opened a year later.
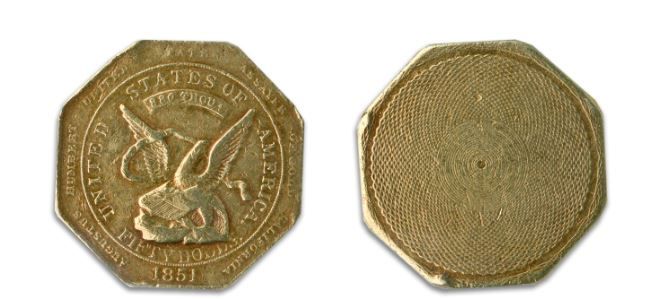
Humbert’s $50 slugs are octagonal, and the obverse features the words “Augustus Humbert United States Assayer of Gold California 1851” on the edges. Inside a circle, an eagle is surrounded by the words “United States of America.” The reverse side of the slugs show an engraved pattern known as “engine turning,” a technique that was difficult to imitate at the time. The coins are quite heavy, and have a pleasant weight in the hand.
The Humbert $50 coin is unusual in nearly every possible way: it was issued by the U.S. government, but not by a mint. It has eight sides. Its obverse is a pattern rather than an image. The eagle is a notably different design from the eagles on future U.S. coins.
For the investor looking for an unusual addition to a collection, or simply a fascinating slice of Gold Rush history, the Humbert $50 is an unbeatable choice.
Gold Alert: Fed Meeting, Jobs Data This Week
Posted on — Leave a commentGold prices gained modestly on Friday, boosted by news that the U.S. economy registered its slowest economic growth reading in three years, which triggered doubts over the health of the current expansion phase.

Spot gold traded up to $1,268.80 an ounce on Friday after the government reported first quarter GDP rose a weaker-than-expected 0.7%.
No government shut-down, this week: Congress on Friday passed a one-week stop-gap spending bill to avoid a partial government shutdown. The stop-gap measure keeps the government open until May 5, so fresh solutions will need to emerge this week.
Gold Market News
A number of key events lie on the docket this week that could impact the gold market including the Federal Reserve’s meeting and Friday’s release of the monthly U.S. jobs report.
1. Fed Meeting This Week
The Fed’s two-day policy setting meeting begins on Tuesday and concludes on Wednesday when the committee will release its policy statement at 2 pm.
The current Fed funds rate stands at 0.75-1.00%.
The CME FedWatch tool is a handy guide to show what the market expects to happen at Fed meetings. The chart below shows only 5.3% odds the Fed will hike interest rates to 1.00-1.25% on Wednesday.
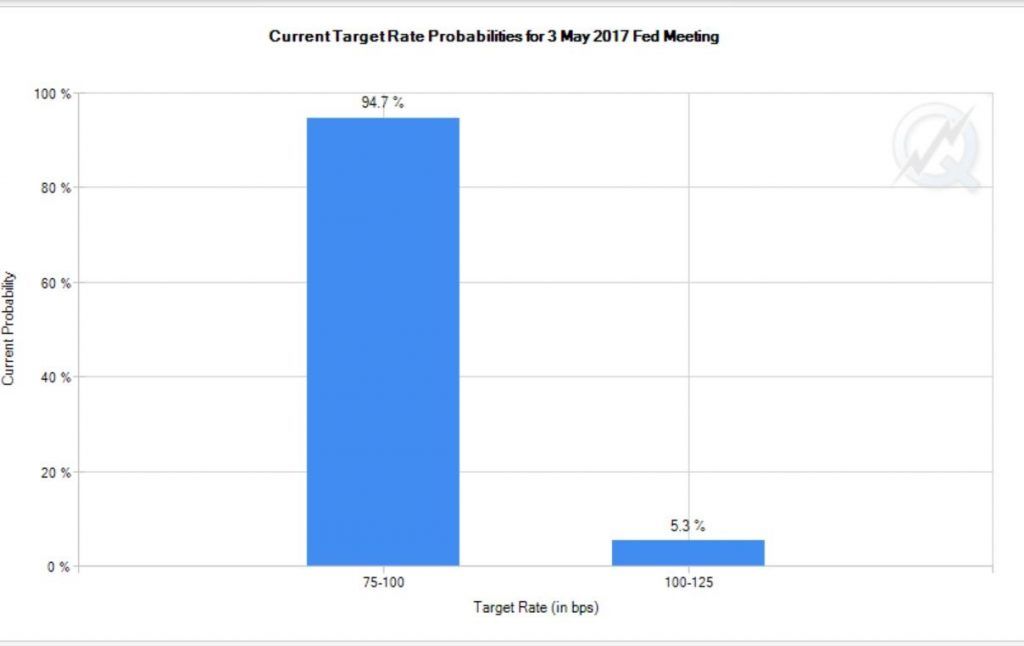
Yes, Wall Street expects the Fed to keep policy on hold at this week’s meeting. There is no press conference scheduled or updated economic projections expected with this meeting. Economic growth and inflation data have been sluggish lately and traders will be watching for clues regarding the Fed’s next moves in the statement on Wednesday afternoon.
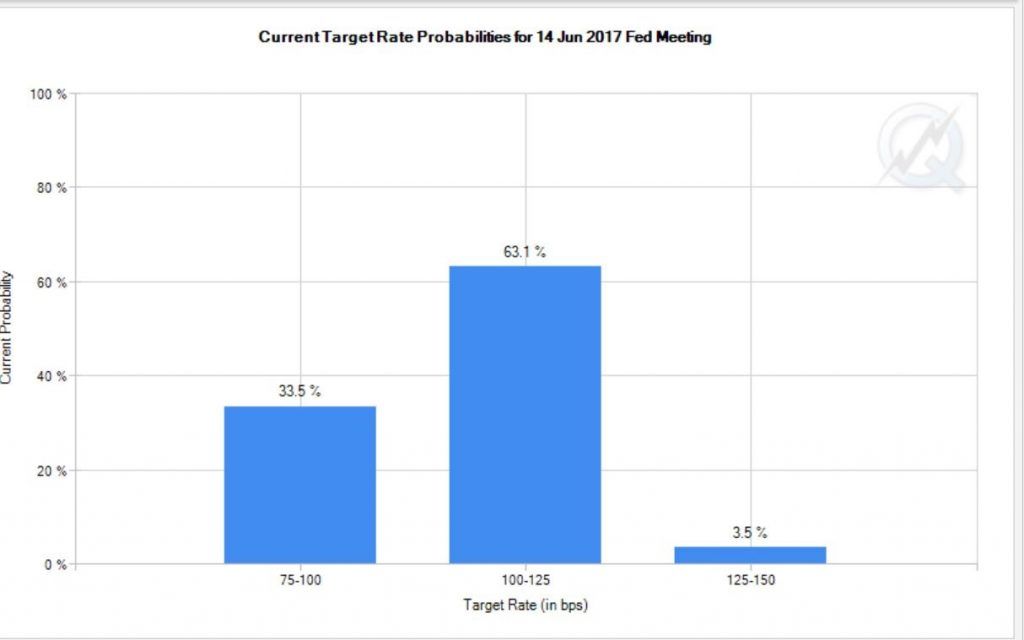
Looking ahead: the Fed meets next on June 13-14, and that meeting will be accompanied with a Summary of Economic Projections and a press conference with Fed Chair Yellen.
The picture looks very different for expectations in June. The CME FedWatch chart below shows the market is currently pricing in 63.1% odds of a rate hike next month.
2. Friday’s release of the April U.S. jobs report
After financial markets have digested any fresh news from this week’s Fed meeting, focus will turn swiftly to Friday’s release of the key U.S. employment report for April. After the surprising slowdown in March, Wall Street will be looking for payroll gains to bounce back in April. Credit Suisse forecasts a 210,000 increase in new non-farm jobs created in April.
Investor alert: If that fails to occur, it could weigh on stocks and boost gold prices.
China, Indian Buyers Scooping Up Gold Bargains
Gold investors around the globe are using current price levels in the yellow metal as a buying opportunity.
“China’s imports of gold via Hong Kong and Switzerland, surged in March. Chinese buyers tend to be price-sensitive and could have seen the correction in the price of gold at the start of March as a buying opportunity. At the same time, India’s imports of gold reached the highest level since December 2015,” according to a Capital Economics commodities note on April 28.
Current levels offer good buying opportunity: At its current $1,268 an ounce level, gold is well off its 2016 highs around $1,375 an ounce. The price trend is bullish for gold and higher prices are forecast for year-end. Now may be the best time of 2017 to scoop up gold or silver at relative bargain prices. If you are looking to diversify your portfolio with tangible assets, act now before prices move significantly higher.
How Much Gold Is Needed to Reduce Portfolio Risk?
Posted on — Leave a commentConventional wisdom holds that including some commodities, like gold, in your portfolio reduces downside risk. Research supports this theory by illustrating that gold reduces volatility due to its lower correlation to stocks. However, recent work from Sweden reveals a surprising detail about this concept. Researchers at the Umea School of Business discovered that the optimal commodity weighting in a portfolio isn’t what most expect.

The authors used a series of statistical models relying on measurements like deviation, variation, and regression to understand how different commodity weightings reduce risk. The authors approached the study from a global perspective. In addition to the S&P 500 index, the researchers examined the Nikkei 225, which is more appropriate for Japanese investors. Other indices included in the study like the DAX 30 and Sensex relate to German and Indian investors respectively. Despite the variety of indexes used, the optimal commodity weighting was surprising across the board.
The results “imply that adding at least 49% commodity index would improve the overall performance of the portfolios.” This “improved performance” is reduced volatility and therefore lower risk. The data studied covered the period starting in January of 1997 and ending in March of 2017.
Why is this finding unexpected? Common advice suggests allocating as little as 5 – 10% towards commodities in a portfolio. For example, in a recent Charles Schwab whitepaper analysts recommended committing just 1-5% of a portfolio to precious metals. “Our results are not in line with the experts’ suggestions since we get considerably high proportions of commodities in investors’ portfolios,” explain the researchers.
Additionally, the 49% weighting is the lowest optimal amount discovered among the indices. When using the Hang Seng Hong Kong index, the researchers found the optimal weighting was a whopping 69%.
It’s important to note that these findings are relative to a portfolio consisting of just two asset classes, stocks, and commodities. Therefore, an optimal commodity weighting of 49% means holding the balance of the portfolio (51%) in stocks. The average optimal commodity index weighting across all indices was 60.5% with a balance of 39.5% in stocks.
The researchers went further and explored why the optimal weighting was so high. This question brought them to gold which “has a volatility close to the lowest one of the stock indices at same time with a noticeably high return, for all time frequencies.” All other commodities studied had higher volatilities. This finding is significant given that the commodity index used in the analysis consisted of 24 components including platinum, sugar, and cotton.
Do these results mean investors should allocate nearly half of their portfolio to gold? Perhaps not, however, the research does give reason to reconsider how powerful gold can be as part of a risk management tool in portfolio design. Gold offers not only the opportunity for substantial long-term asset growth but also stability when it’s needed most. These research results come at a critical time. Geopolitical tensions are rising, volatility is growing, and U.S. policy is an uncertain as ever.
How Does Trump’s First 100 Days Stock Rally Rate?
Posted on — Leave a commentThe first 100 days of a new President’s administration historically has been viewed as a barometer of the type of governance that will unfold during a four-year term.

The historical comparisons harken back to the days after President Franklin D. Roosevelt took office at the height of the Great Depression. Amid economic turmoil and human hardship, the new President ultimately signed 76 bills into law in his first 100 days and ushered out his New Deal programs swiftly.
All U.S. presidents have since been compared to the accomplishments achieved by FDR in his 100 days.
President Trump will reach his 100-day mark on Saturday April 29.
How does President Trump’s first 100 days stock rally rank?
The answer may surprise you: about average.
Middle of the Pack
“The Dow over the first 100 days has been higher with the past five presidents by 4.6% on average, and the Dow is currently up 2.9% since President Trump took office. With a median return of 2.7%, this would rank near the middle of the pack for all presidents going back to 1900,” says Ryan Detrick, senior market strategist at LPL Financial.
“Most might find that surprising, but of course, much of the Trump rally took place prior to his inauguration, and those gains don’t count in this case,” Detrick says.
Stock Investors Are Losing Faith
Stock market bulls are simply running out of gas.
During the post-election rally phase, U.S. stocks priced in a significant amount of “expectations” and good news to come. To date, the new Republican controlled Congress has delivered little in the way of the economic growth boosting proposals it promised. Stocks are beginning to look heavy.
Optimism among individual investors about the short-term direction of stock prices is at a new post-election low, according to the latest American Association of Individual Investors (AAII) Sentiment Survey. (The AAII Sentiment Survey has been conducted weekly since July 1987 and asks AAII members whether they think stock prices will rise, remain essentially flat or fall over the next six months.)
Bearish sentiment, or expectations that stock prices will fall over the next six months, hit 38.7% in the AAII’s latest survey. The rise keeps pessimism at or above its historical average of 30.5% for the 10th consecutive week and the 13th out of the last 14 weeks.
Stocks Are Entering a Seasonally Weak Period
May 1 is just around the corner. You may have heard the old stock market adage: Sell in May and Go Away. The stock market historically underperforms in the May through October period. This year’s off-season for stocks could be even worse than normal. The stock market bull cycle that began in March 2009 is old and stretched by historical and valuation standards.
Act Now To Protect Your Portfolio
The dominoes are lined up and ready to tip over at any time for the stock market. The first 100 days or the so-called honeymoon period is just about to end.
Gold is a proven portfolio diversifier and typically rises significantly when stocks enter a correction or bear market. Move quickly to properly protect your assets. Contact Blanchard today at 1-800-880-4653 for a personalized portfolio review.